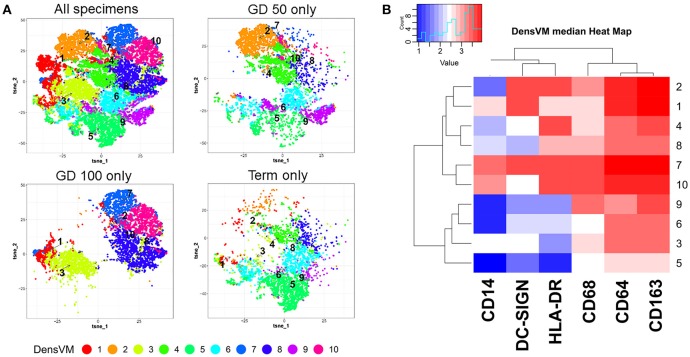
Figure 1.
Marker defined HBC subsets within macaque placenta collected at different stages of gestation: Gestation day (GD) 50 ± 2 days (n = 2), GD100 ± 2 days (n = 2), and Term. (A) t-SNE visualization of DensVM generated HBC clusters of combined flow cytometry data from all gestation stages (All specimens) and by each individual gestation stage. (B) Marker and cluster specific DensVM median heatmap generated with flow cytometry data from all gestation stages. Clustering was ranked by both HBC cluster group (designated by row) and marker median expression (column). Images were created with Cytofkit ShinyAPP (22).

