Figure 3.
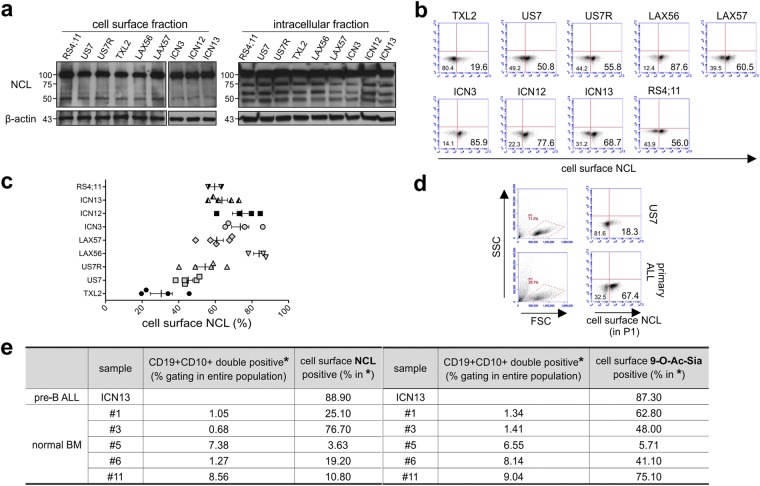
The 100 kDa NCL glycoform is expressed on the surface of pre-B ALL cells. Analysis of the indicated pre-B ALLs using NCL antibody. (a) Western blotting on cell surface (biotinylated) and intracellular (non-biotinylated) fractions. Note: Different WB membranes of the two fractions; the WB of the intracellular fraction was exposed shorter than that of the cell surface fraction. (b–e) Flow cytometry. (b) Representative analysis of cell surface NCL in different pre-B ALLs. (c) Summary graph of n = 2–5 independent experiments with the indicated pre-B ALLs. (d) NCL expression in gate P1 on primary fresh pre-B ALL PB sample containing >95% blasts. For FACS, cells were fixed without permeabilization. (e) Analysis for cell surface NCL and 9-O-Ac-Sia on normal pre-B cells. Percentage of cells in five different normal bone marrow samples, processed as described in Materials and Methods, that were positive for cell surface NCL and 9-O-Ac-Sia in the CD19+, CD10+ gate (gating strategy, see Supplementary Fig. S3). ICN13, positive control run in the same experiment.

