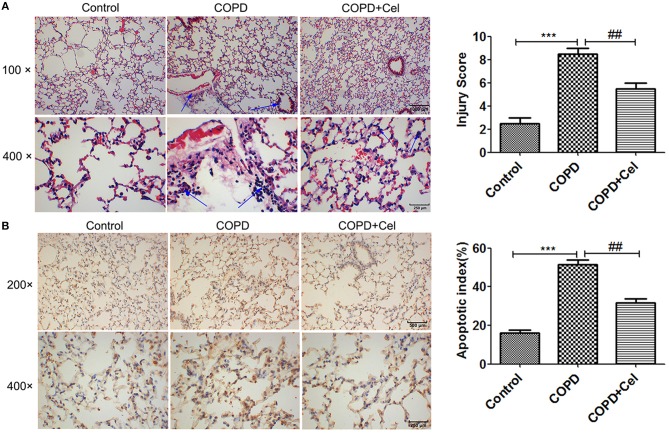
Figure 1.
Pathological examination of mouse lung tissue. (A) HE staining of mouse lung tissue and viewed under the light microscope (× 100,scale bars = 1000 μm or × 400,scale bars = 250 μm). (B) Apoptosis in mouse lung tissue detected by TUNEL assay and histogram of the apoptosis rate of cells in mice lung tissue amongst control, COPD and COPD+celastrol groups (× 200, scale bars = 500 μm or × 400, scale bars = 250 μm. Blue arrow indicates the site of inflammation in (A); the condensed and fragmented nuclei are indicated with arrows in (B). Values are expressed as the mean ± SEM (n = 5); *p < 0.05, **p < 0.01, ***p < 0.001 with respect to the control group; #p < 0.05, ##p < 0.01 with respect to the COPD group.

