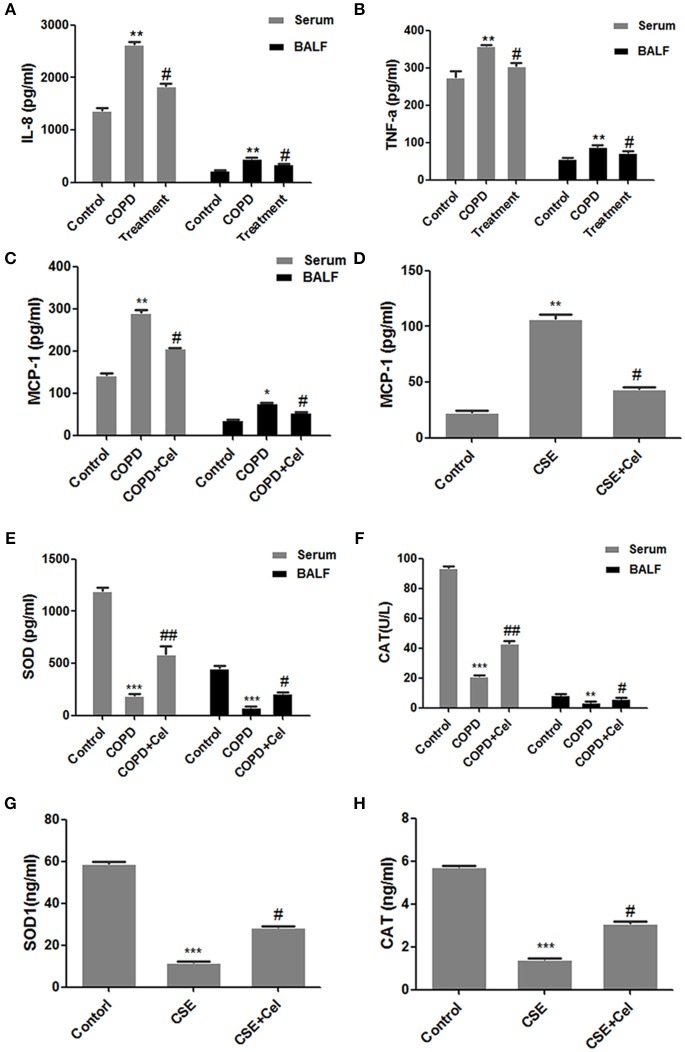
Figure 2.
Detection of inflammation- and oxidative stress-related factors. (A) IL-8 levels in mouse serum and bronchoalveolar lavage fluid (BALF). (B) TNF-a levels in mouse serum and bronchoalveolar lavage fluid (BALF). (C) MCP-1 levels in mouse serum and BALF. (D) MCP-1 levels in the supernatant of Beas-2B cells. (E) SOD levels in mouse serum and BALF. (F) CAT levels in mouse serum and BALF. (G) SOD levels in the supernatant of Beas-2B cells. (H) CAT levels in the supernatant of Beas-2B cells. Each result was derived from three independent experiments. Control group were treated with DMSO; CSE group were treated with CSE and DMSO; CSE + celastrol were treated with CSE and celastrol. Values are expressed as the mean ± SEM (n = 3); *p < 0.05, **p < 0.01, ***p < 0.001 with respect to the control group; #p < 0.05, ##p < 0.01 with respect to the CSE group or COPD group.

