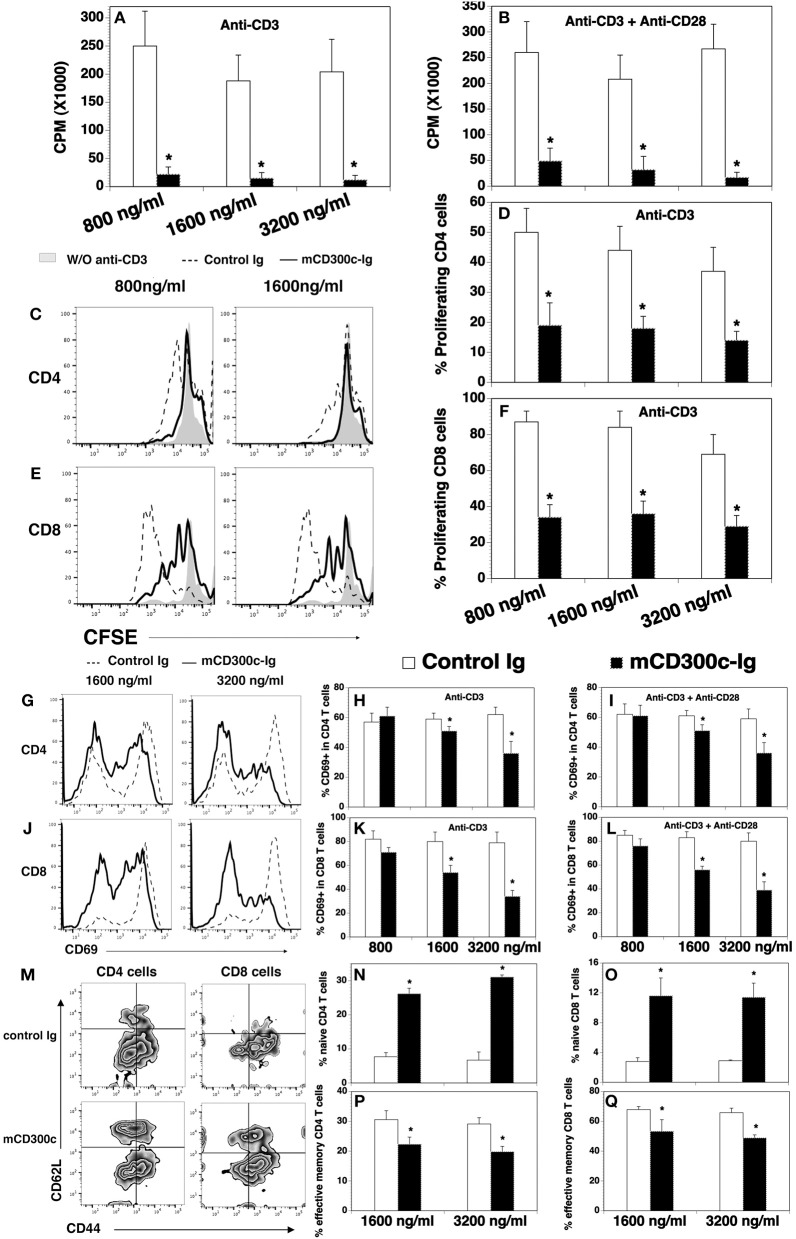
Figure 3.
The effects of mCD300c-Ig protein on the proliferation and activation of mouse T cells in vitro. (A,B) CD3+ T cells were isolated from the spleen of C57BL/6 mice and cultured with (A,B) plate-bound anti-CD3 antibody (1 μg/ml) and (B) anti-CD28 antibody (0.5 μg/ml) in the presence of graded doses of mCD300c2-Ig protein (800, 1,600, and 3,200 ng/ml) or equimolar amounts of control Ig protein for 3 days. Cell proliferation was measured by [3H] thymidine incorporation. (C–F) Mouse splenic cells were labeled with CFSE and cultured with anti-CD3 antibody (1 μg/ml) and graded doses of mCD300c2-Ig protein or control Ig protein as (A). The cells were then stained with anti-CD4 and CD8 antibodies and analyzed for CFSE levels by CD4+ and CD8+ T cells. (C,E) Representative flow cytometric analysis of CFSE distribution of CD4+ or CD8+ T cells. (D,F) Statistical analysis of CFSElo proliferating CD4+ or CD8+ T cells. (G–Q) Mouse splenic cells were cultured with (G–Q) anti-CD3 antibody and (I,L) anti-CD28 antibody in the presence of graded doses of mCD300c2-Ig or control Ig protein as (A,B). The cells were analyzed for the expression of (G–L) CD69 24 h later, (M–Q) CD44, and CD62L 72 h later. (G,J,M) Representative flow cytometric profiles, and (H,I,K,L,N–Q) statistical analyses of the percentages of CD69+, CD44lowCD62Lhi naïve, and CD44hiCD62Llow effective memory CD4 and CD8 T cells. The data were pooled from 3 independent experiments and expressed as mean ± SD. *P < 0.05 compared with control Ig.

