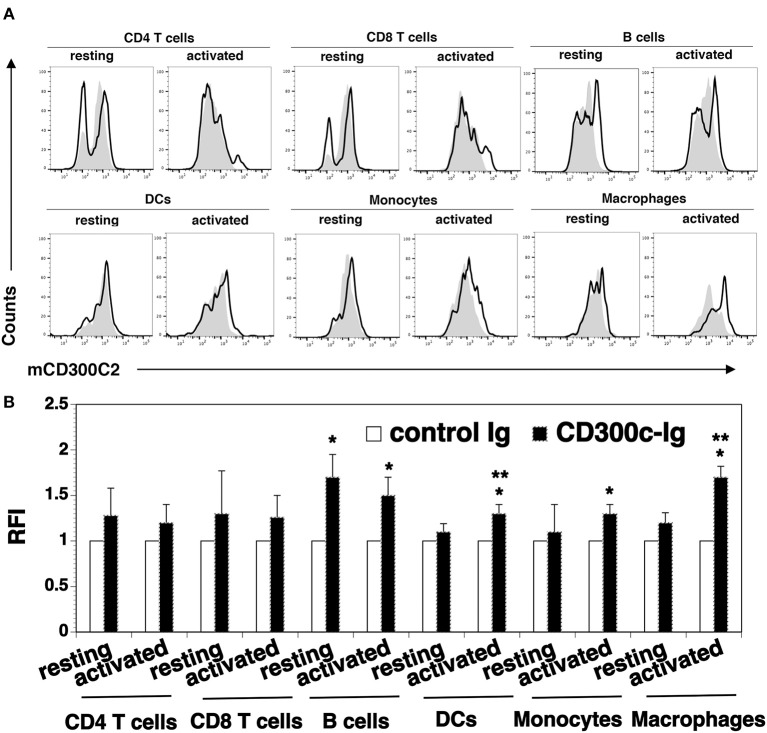
Figure 5.
Analysis of the expression of mCD300c2 on immune cells. Splenocytes from C57BL/6 mice were freshly harvested and used for resting immune cells. To initiate T cell activation, splenocytes were incubated with anti-CD3 (1 μg/ml) and anti-CD28 (0.5 μg/ml) antibodies for 3 days. For activated B cells, DCs, monocytes and macrophages, splenocytes were incubated with LPS (10 μg/ml) for 3 days. The resting and activated immune cells were stained with anti-mCD300c2 antibody (Ab) (open histograms) or isotype Ab (shaded histograms), as well as, anti-CD4, CD8, B220, CD11c, CD11b, or F4/80 Ab to identify immune cells. (A) Representative flow cytometric profiles and (B) statistical analysis showing the expression of mCD300c2 on resting and activated immune cells. (B) The data were pooled from 3 independent experiments and presented as relative fluorescence intensity (RFI) for the expression of mCD300c2 on activated cells vs. resting cells. *P < 0.05 compared with isotype Ab. **P < 0.05 compared with resting cells.

