
Fig. 4.
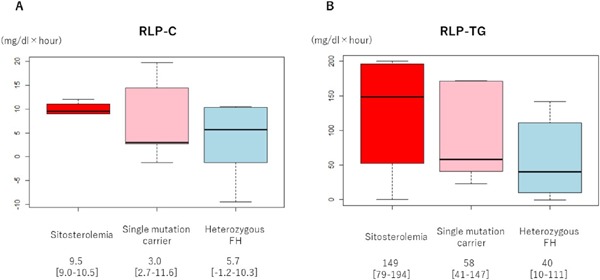
The iAUC of RLP fractions
Boxplots illustrating the iAUC of (A) RLP-C and (B) RLP-TG in three groups.
Red: Sitosterolemia
Pink: Single mutation carrier
Light blue: Heterozygous FH
Official websites use .gov
A
.gov website belongs to an official
government organization in the United States.
Secure .gov websites use HTTPS
A lock (
) or https:// means you've safely
connected to the .gov website. Share sensitive
information only on official, secure websites.
The iAUC of RLP fractions
Boxplots illustrating the iAUC of (A) RLP-C and (B) RLP-TG in three groups.
Red: Sitosterolemia
Pink: Single mutation carrier
Light blue: Heterozygous FH