Fig. 3.

Cells surrounding macrophages in the intima
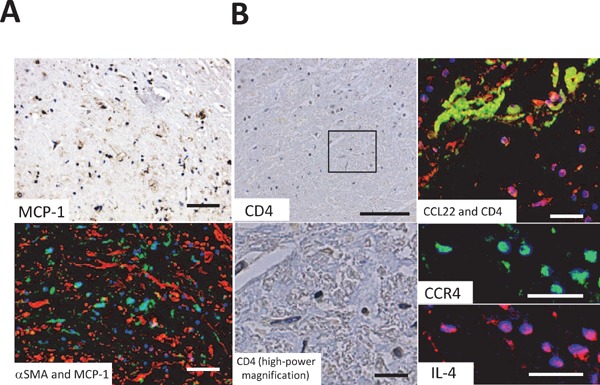
Fig. A is the same area as Fig. 1B-β and Fig. B is the same area as 1B-γ. Fig. A MCP-1 shows monocyte chemoattractant protein (MCP)-1 immunohistochemical staining (green) and Fig. A MCP-1 and α-smooth muscle actin (αSMA) shows immunofluorescence staining of both MCP-1 (green) and αSMA (red). MCP-1-positive cells and smooth muscle cells were present in close proximity. Fig. B CD4 and CD4 high-power magnification (high-power magnified image of the box in Fig. B CD4) show the immunohistochemical staining of CD4. Fig. B CCL22 and CD4 show immunofluorescence staining of both CCL22 (green) and CD4 (red). Fig. B CCR4 and interleukin (IL)-4 (high-power magnified image of Fig. B CCL22 and CD4) shows immunofluorescence staining of CCR4 (CCL22 receptor; green) and IL-4 (red). CD4-positive cells appeared around CCL22-positive cells whereas CD4-positive cells showed CCR4-staining and expressed IL-4. Blue staining (DAPI) indicates the nuclei of cells.
Bars indicate 50 µm (Fig. A), 100 µm (Fig. B CD4) and 30 µm (Fig. B CD4 [high-power magnification], CCL22 and CD4, CCR4, and IL-4).
