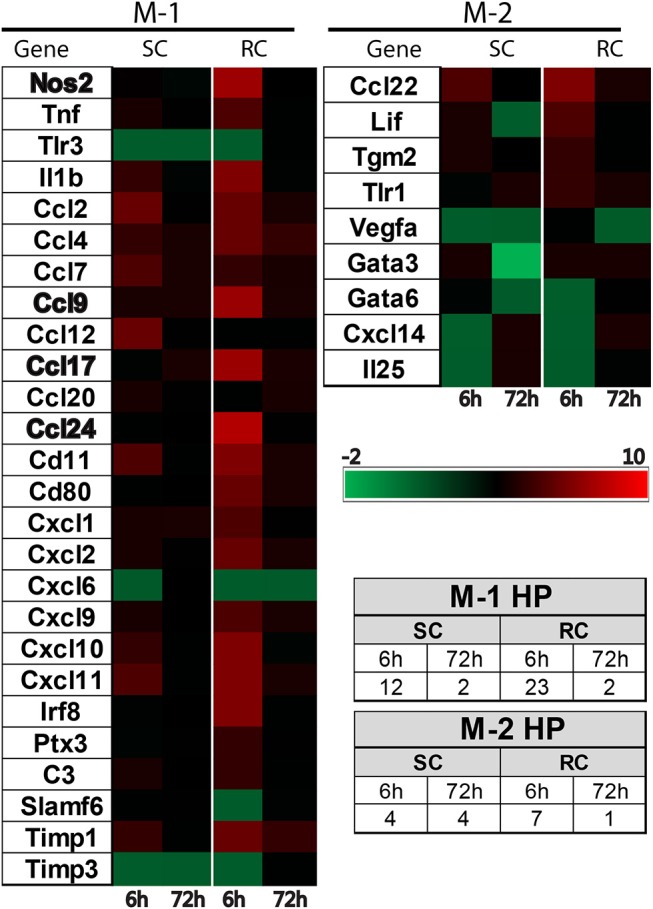
Figure 5.

Heat map showing inflammatory gene profiling of the ipsilateral hippocampus following concussive brain injury. Custom designed qRT-PCR mini-array identified genes that are upregulated (Red, ≥ 1.5 fold positive change compared to sham group) or downregulated (Green, ≥ 1 fold negative change compared to sham group). Left panel heat map shows altered M-1 markers and right panel shows M-2 markers that were changed. Names of the genes expressed more than 6 fold are identified in bold. Table insert shows the total number of genes that are changed under each condition. SC: single concussion, RC: repeated concussion, HP: hippocampus.
