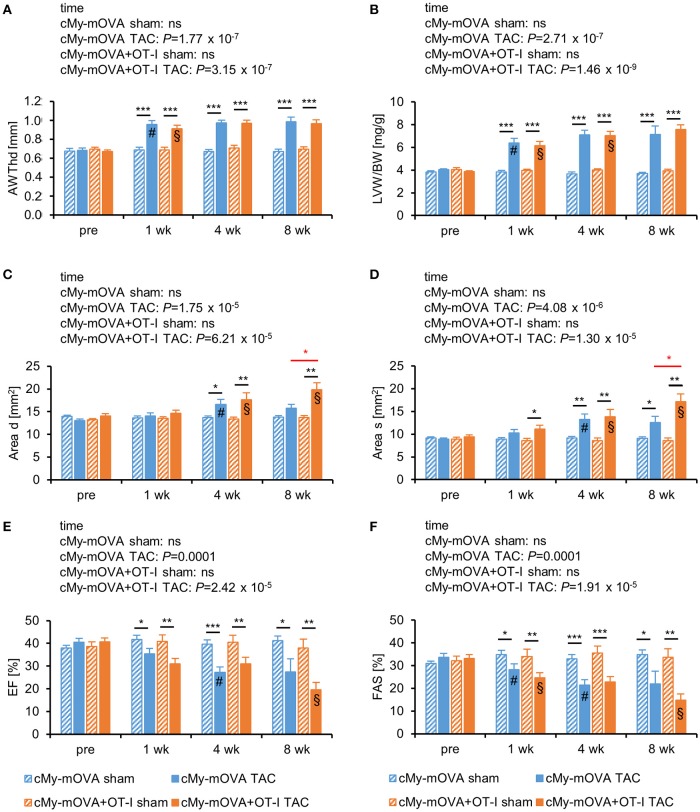
Figure 2.
OVA-specific CD8+-T cells promote cardiac dilatation but do not accelerate the progression from hypertrophy to heart failure after TAC in cMy-mOVA mice. Echocardiography was performed in cMy-mOVA and in cMy-mOVA+OT-I mice before (pre; n = 14 per group for cMy-mOVA and n = 11 per group for cMy-mOVA+OT-I mice) as well as 1 week (n = 14 for cMy-mOVA and n = 11 for cMy-mOVA+OT-I mice), 4 weeks (n = 14 cMy-mOVA and n = 11 (sham) or 10 (TAC) for cMy-mOVA+OT-I mice), and 8 weeks (n = 14 (sham) or 10 (TAC) for cMy-mOVA and n = 11 (sham) or 9 (TAC) for cMy-mOVA+OT-I mice) after sham or TAC surgery. (A) Anterior wall thickness in diastole (AWThd), (B) left ventricular weight/body weight (LVW/BW) ratio, (C) area of the endocardium in diastole (Area d), (D) area of the endocardium in systole (Area s), (E), ejection fraction (EF), and (F) fractional area shortening (FAS) were determined and means plus SEM are displayed. Differences between the time points within each experimental group were analyzed by a mixed linear model (time) and the P-values are given in the panels. Significant differences in the Bonferroni post hoc test (P < 0.05) compared to the previous time point are indicated for cMy-mOVA (#) and cMy-mOVA+OT-I mice (§). Differences between sham and TAC groups at a given time point were analyzed by t-tests and significant differences are indicated by black bars (*P < 0.05, **P < 0.01, ***P < 0.001). Similarly, differences between cMy-mOVA and cMy-mOVA+OT-I mice after TAC were analyzed and red bars and stars indicate significant P-values.

