Figure 3.
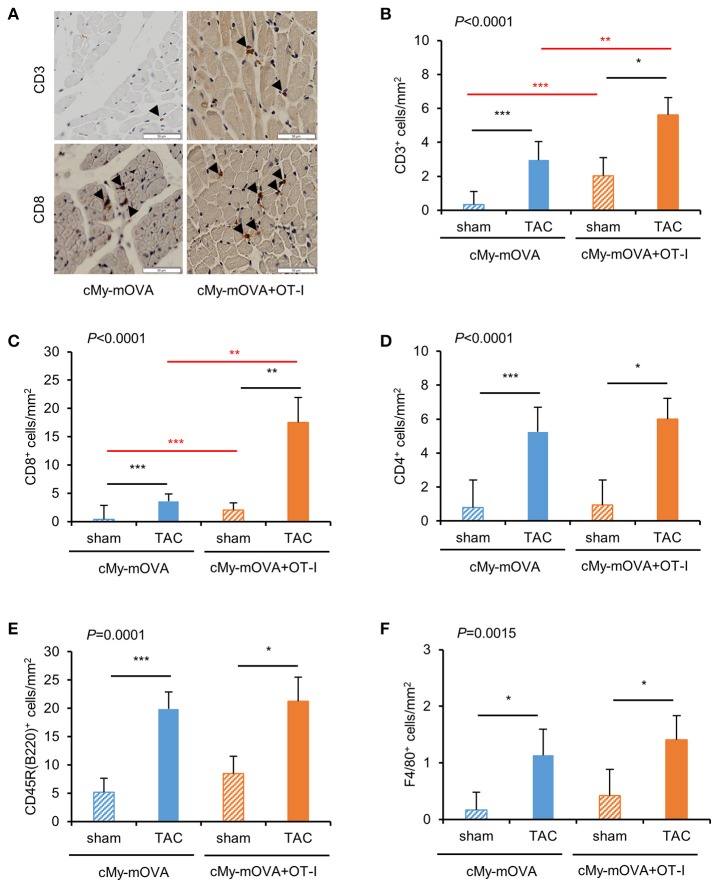
More infiltration of CD3+ and CD8+ cells in the myocardium of cMy-mOVA+OT-I than cMy-mOVA mice. (A) The infiltration of CD3+ and CD8+ cells was analyzed by immunohistochemistry in the myocardium of sham and TAC-operated cMy-mOVA and cMy-mOVA+OT-I as illustrated here. The bars indicate 50 μm. The arrow heads point to CD3+ or CD8+ cells, respectively. The numbers of infiltrating CD3+-T cells (B), CD8+ cells (C) CD4+ cells (D), CD45R(B220)+ B cells (E) and F4/80+ monocytes/macrophages (F) were determined in the myocardium after 10 weeks in sham and TAC-operated cMy-mOVA (sham n = 14, TAC n = 10) and cMy-mOVA+OT-I mice (sham n = 11, TAC n = 9) and means plus SEM are shown. The P-value of a Kruskal-Wallis test comparing all groups is indicated. Differences between two groups were analyzed by U-tests and significant P-values are given in the panels (*P < 0.05, **P < 0.01, ***P < 0.001). The Bonferroni-Holm correction was used to adjust for multiple testing in the two group comparisons.

