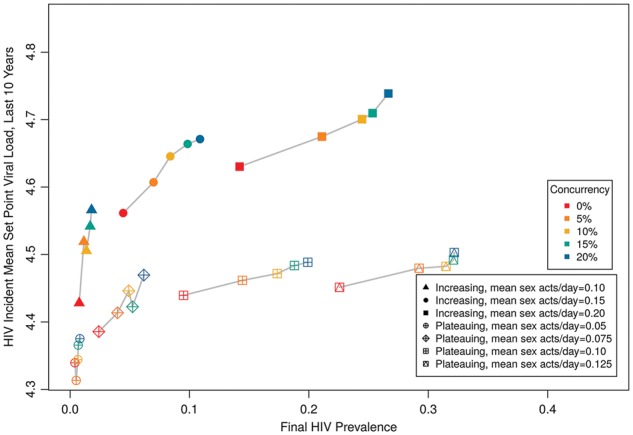
Figure 7.

HIV prevalence by MSPVL, comparing two functional forms for the relationship between VL and transmission (continually increasing vs. plateauing), for a range of coital frequencies and concurrency levels. Here the filled symbols signify the increasing transmission function, open symbols signify the plateauing transmission function. Because the two models yielded different prevalence levels with default parameters, we vary coital frequency over different ranges for the two forms in order to compare across scenarios with similar prevalence.
