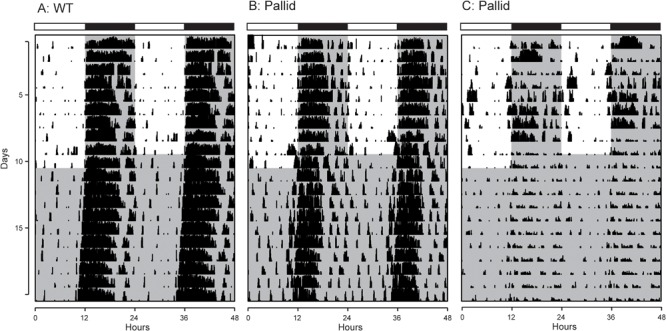
FIGURE 2.

Examples of cage activity rhythms recorded from wild-type (WT) and pallid mice. Double-plotted actograms of cage activity in Light-Dark (LD) and Dark-Dark (DD) conditions. (A) Activity rhythm of age-matched WT control mouse. The pallid mice exhibited some heterogeneity in response with (B) showing the record from the least impacted and (C) showing the most impacted pallid mouse. The activity levels in the actograms were normalised to the same scale (85% of the maximum of the most active individual). All mice had a cage change on the day before the transition from LD to DD, to which some responded with a transient increase in activity. Each row represents two consecutive days, and the second day is repeated at the beginning of the next row. The white/black bar on the top of each panel indicates the 12:12 h Light-Dark cycle, and grey shading in the waveforms indicates the time of dark exposure.
