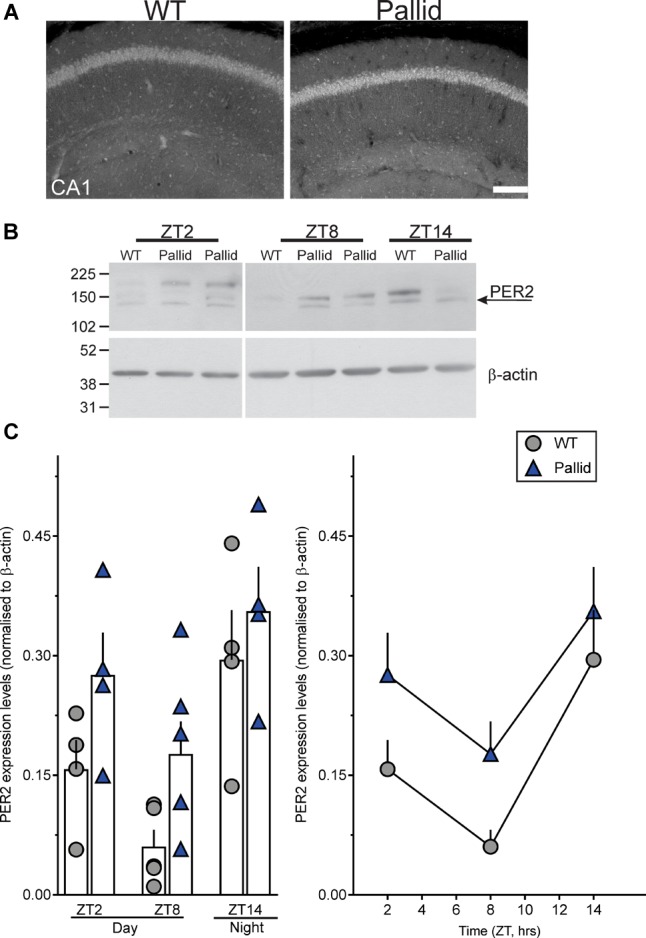
FIGURE 9.

Altered PER2 expression levels in the pallid hippocampus during the day. (A) Representative images showing increased PER2 immunoreactivity in CA1 in pallid mice during the day at Zeitgeber Time (ZT) 8. WT, wild-type. (B,C) Daily rhythms in PER2 expression levels were observed in WT and pallid mice, with the latter exhibiting consistently higher expression levels of PER2 during the day (ZT2 and ZT8). (B) Representative immunoblots. (C) Elevated PER2 protein levels in whole hippocampal tissue lysates from pallid mice. Values derived from the densitometric analysis were corrected for the background, normalised to β-actin and represented as the means ± SEM of 4-7 animals/time-point/genotype. Two-way ANOVA followed by Bonferroni’s Multiple Comparisons test revealed statistically significant effects of both genotype and time (Table 4), but not of their interaction or significant genotypical differences at each time-point. Scale bar = 100 μm.
