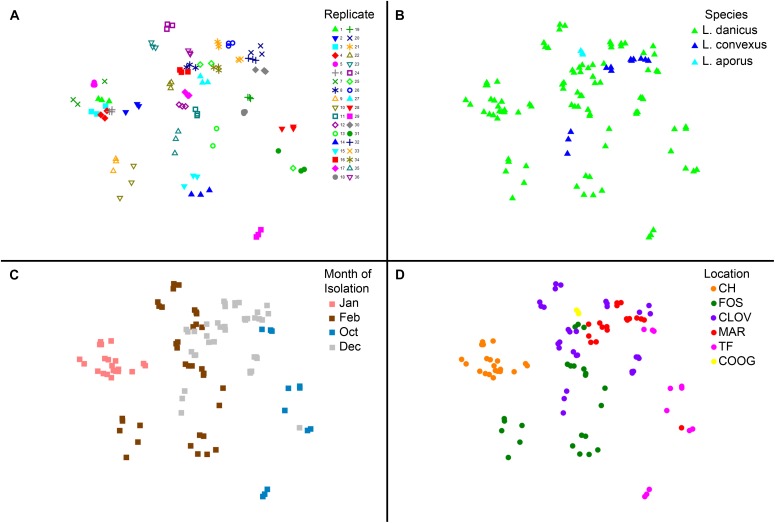
FIGURE 4.
(A–D) Multivariate two dimensional scatter plots plots showing the variation in bacterial communities between (A) replicates (each strain contains three replicates); (B) between species of the diatom Leptocylindrus – L. danicus, L. convexus, and L. aporus; C. between sampling times (4 months) and (D) between collection locations along the east coast of Australia.

