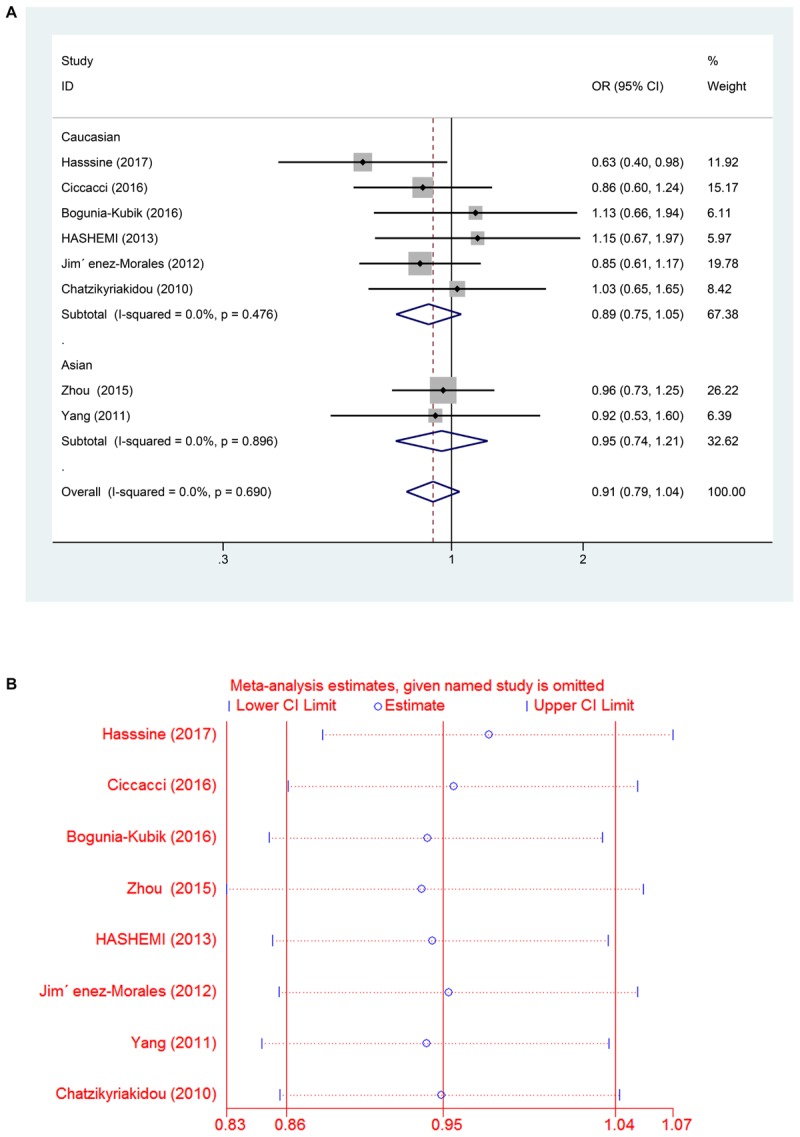
FIGURE 3.

(A) Forest plot for association between miR-146a rs302789 polymorphisms and risk of rheumatoid arthritis under dominant genetic model (GC/CC vs. GG) after stratification analysis by ethnicity. (B) The sensitivity analysis for studies of the association between miR–146a rs302789 polymorphisms and risk of rheumatoid arthritis under allele genetic model (C vs. G).
