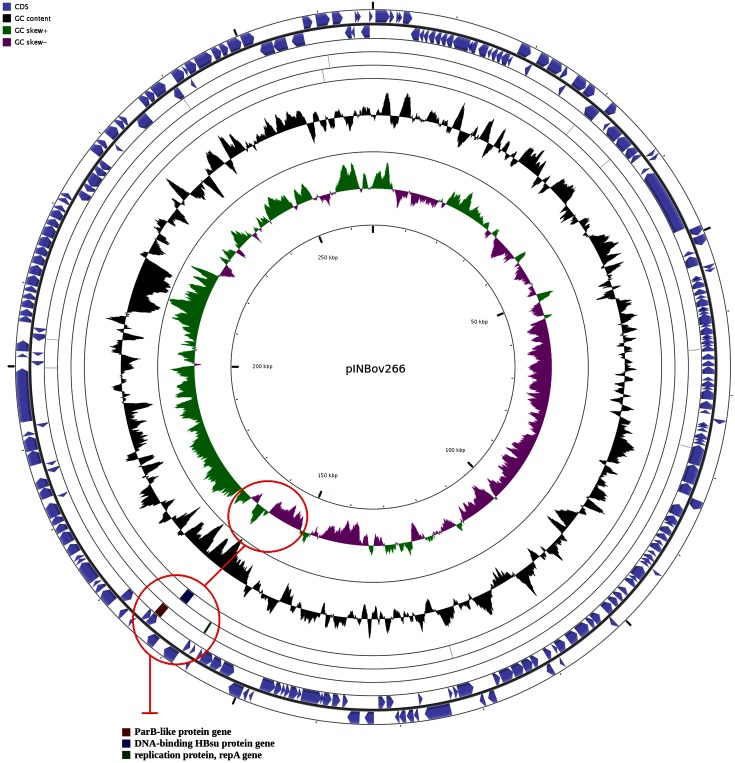
Fig. 3.
Circular visualization of the chromid sequence (pINBov266) in Cgview. The location of parB, hbs and repA genes are shown by red circles. The upper circle shows that these genes are located in a region where the GC skew switches the nucleotide frequency polarity. The lower circle corresponds to the blast hits of the genes parB (red), hbs (blue) and repA (green).

