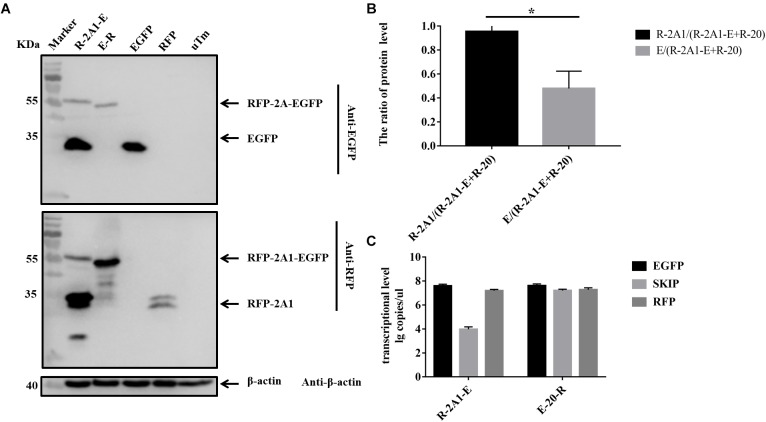
FIGURE 7.
The expression level and RNA level of pcDNA3.1-RFP-2A1-EGFP. Experimental materials of each panel were from the same batch of samples. (A) The protein expression of pcDNA3.1-RFP-2A1-EGFP. The top half was immunoblotted with EGFP mAb. The bottom half was immunoblotted with RFP mAb. EGFP and RFP represent the control plasmid pEGFP-N1 and pDsRed-Express-C1, respectively. uTm represent the sample which was not transfected. (B) Expression comparison of upstream RFP and downstream EGFP in pcDNA3.1-RFP-2A1-EGFP. (C) The transcriptional level of pcDNA3.1-RFP-2A1-EGFP. Five biological duplication were performed in each panels. Statistically significant differences were determined by one-way ANOVA. ∗P < 0.05, ∗∗P < 0.01, ∗∗∗P < 0.001, ∗∗∗∗P < 0.0001 indicate the level of statistical significance of differences between different groups.

