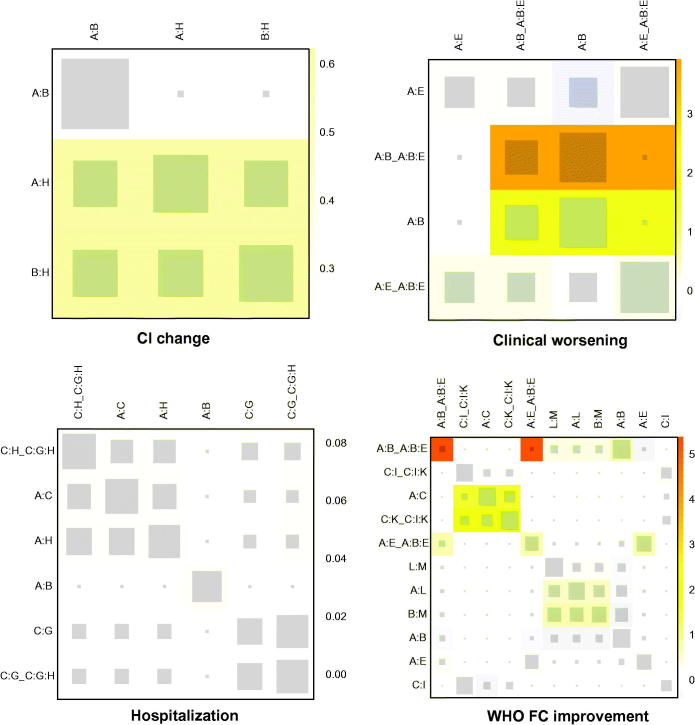
Figure 4.
Heat plots of CI change, clinical worsening, hospitalization and WHO FC improvement. The area of the gray squares displays the contribution of the direct estimate in the design shown in the column to the network estimate in the design shown in the row. The colors are associated with the change in inconsistency between direct and indirect evidence. Blue colors indicate a decrease and warm colors indicate an increase (the stronger the intensity of the color, the stronger the change). A: placebo; B: bosentan; C: ambrisentan; D: macitentan; E: sitaxsentan; F: berapost; G: treprostinil; H: epoprostenol; I: ambrisentan + tadalafil; J: vardenafil; K: tadalafil; L: sildenafil; M: sildenafil + bosentan; N: sildenafil + epoprostenol; O: iloprost + bosentan; P: bosentan + epoprostenol; Q: riociguat + sildenafil; R: riociguat; S: selexipag.

