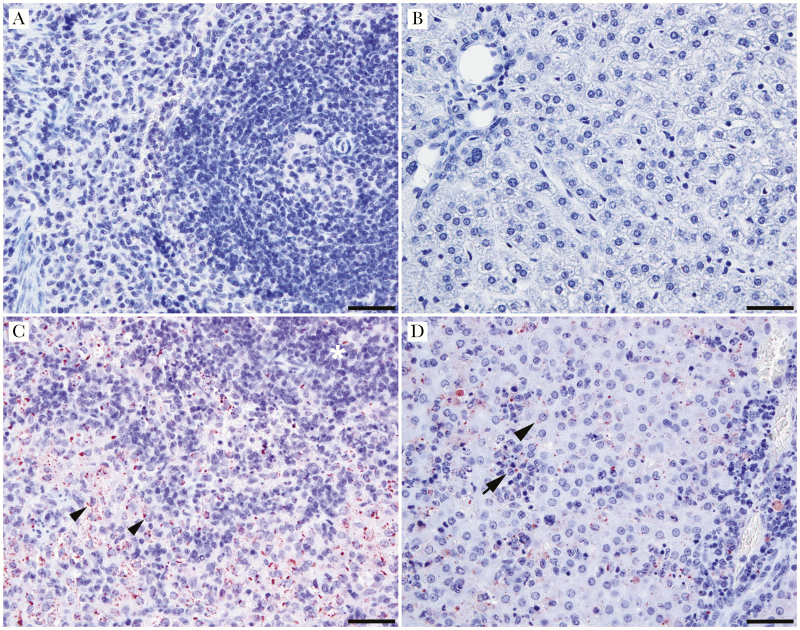
Figure 5.
Marburg virus (MARV) immunohistochemistry in MARV Musoke–infected STAT2 knockout (KO) hamsters. A, B, Spleen (A) and liver (B) of mock-infected control animal at 2 days post infection (dpi). C, MARV-infected spleen at 5 dpi showing immunoreactivity in mononuclear cells (arrowheads) in the splenic white (asterisk) and red pulps. D, MARV-infected liver at 5 dpi with immunoreactivity in hepatocytes (arrowhead), mononuclear inflammatory cells (arrow) and endothelial cells. Inset: higher magnification showing immunoreactivity in hepatocytes (arrowhead). (Scale bars denote 50 μm; hematoxylin-eosin stain, original magnification ×400; inset, ×100 magnification.)

