Figure 1.
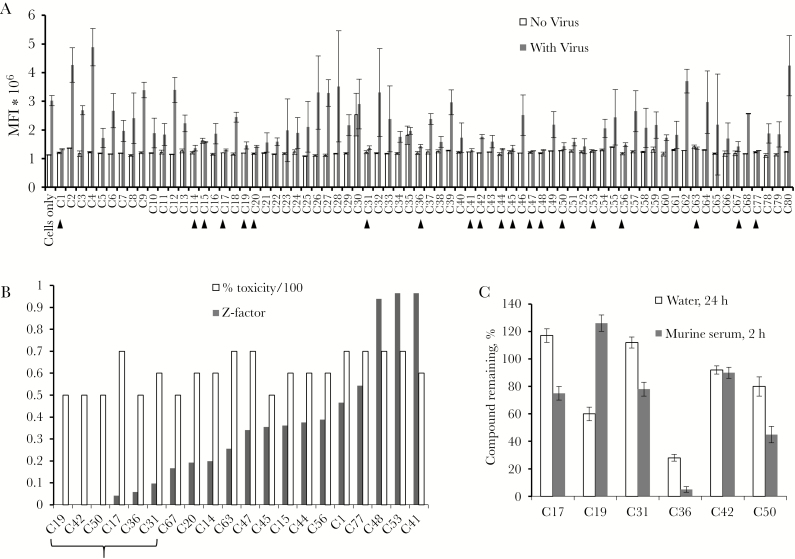
Screening of 1E7-03 analogues. A, High-throughput assays with Ebola virus expressing enhanced green fluorescent protein (EBOV-eGFP). Mean fluorescence intensity (MFI) of Vero E6 cell monolayer treated with 10 µM compound alone (white bars) and 10 µM compound followed by EBOV-eGFP infection (multiplicity of infection, 0.03 plaque-forming units/cell; dark gray bars). Compounds that showed EBOV inhibition are indicated with arrows. B, Antiviral effect and percentage toxicity of the top 20 inhibitory compounds with Z-scores of ≥0.5. Shown are Z-factors (white bars) and percentage toxicity (scale 1/100; dark gray bars). Vero E6 cells were treated with 10 µM concentrations of compound and screened for toxic effect, using the ViralToxGlo (Promega) kit. Z-factors were calculated from MFI data from panel A. Marked are 6 compounds with a percentage toxicity of <10% that were chosen for further analysis. C, Stability of the 6 top EBOV inhibitory compound in water solution (24 hours; white bars) and murine serum (2 hours; dark gray bars).

