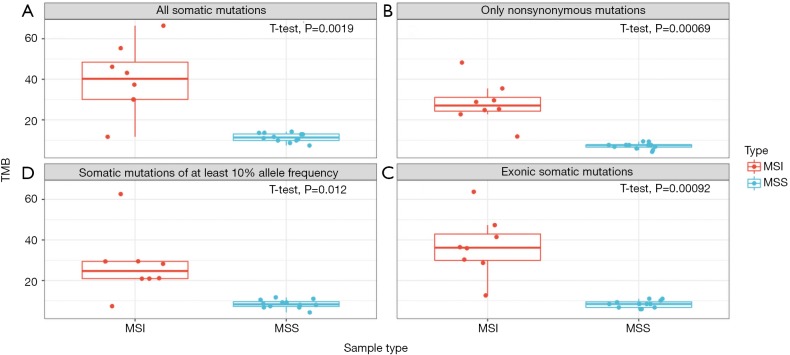
Figure 7.
Comparison of four approaches for defining TMB through stratifying eight MSI and twelve MSS CRC tumors. In all cases, allele ratio is set at 5% except for D. The denominator is every base in the panel for case A and D or every exonic base for B and C; additional scaling factors in the denominator to normalize for the number of bases considered are not applied. (A) High statistical significance in grouping when TMB is defined as per megabase rate of all somatic mutations from the full TML panel (including coding and non-coding regions); (B) high statistical significance in grouping when TMB is defined with high statistical significance when TMB is defined as per megabase rate of nonsynonymous somatic mutations in the exonic region on TML panel; (C) high statistical significance in grouping when TMB is defined as per megabase rate of all somatic mutations in the exonic region on TML panel; (D) moderate statistical significance in grouping when TMB is defined as per megabase rate of all somatic mutations at and above 10% allelic frequency from the full TML panel (including coding and non-coding regions). TMB, tumor mutational burden; MSI, microsatellite instable; MSS, microsatellite stable; TML, tumor mutation load.

