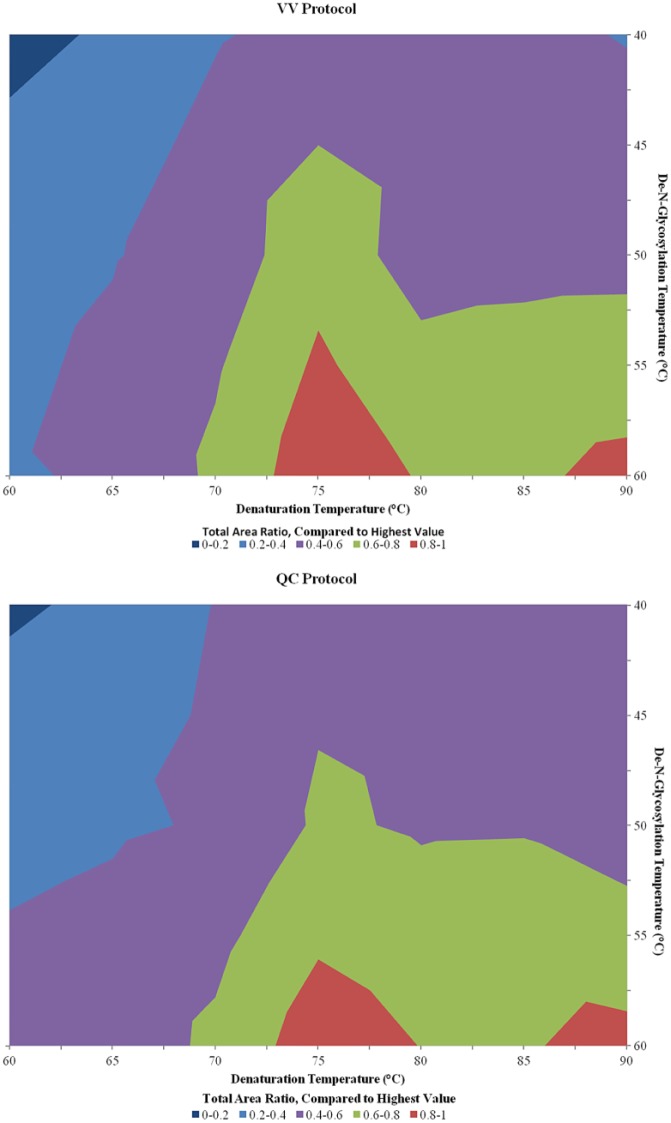
Figure 5.
Contour charts showing the summed total area of all monitored N-glycans under differing denaturation and de-N-glycosylation temperatures. The total areas for all N-glycans monitored (Fig. 4) were summed for each temperature test. Sums were converted into a ratio in comparison with the largest observed value. Data from the three proteins used were averaged together for the contour charts. Data points for temperature tests not performed (see list in Materials and Methods) were generated by averaging the surrounding data points. Sixteen total samples were generated simultaneously for each test, eight using the QC method and eight using the VV method (two each for cetuximab, RNase B, and murine IgG1), with three exceptions. Only one sample was generated for cetuximab using the VV method during the 90/40 (denaturation temperature [°C]/de-N-glycosylation temperature [°C]) and 80/50 tests, and only one RNase B sample during the QC method of the 80/50 test, bringing the sample count to seven.

