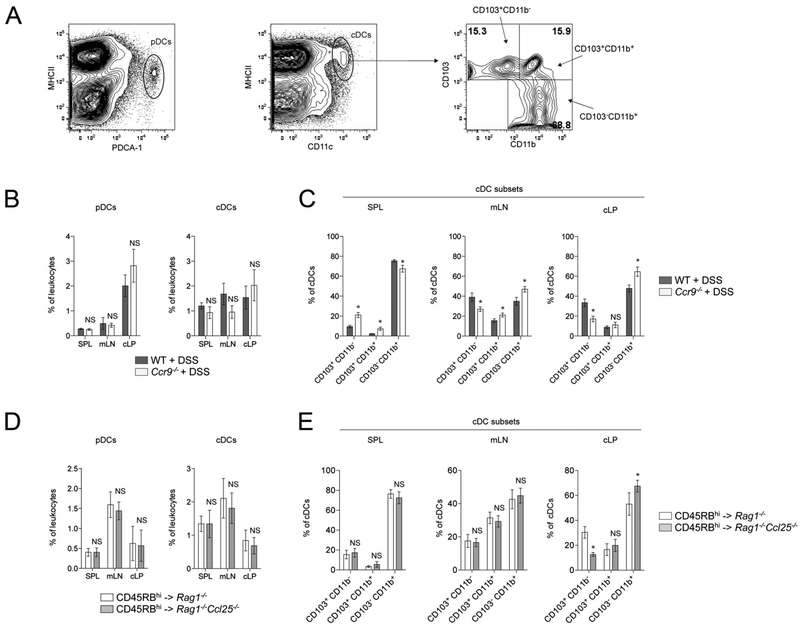
FIGURE 6.
Altered cDC subset distribution in colitic mice lacking CCL25/CCR9 interactions. A, Flow cytometry gating strategy to identify PDCA-1+ MHCIIlo pDCs (left), CD11chi MHCIIhi cDCs (middle), and cDC subsets (right). B, The pDC (left) and cDC (right) distribution analyses in SPL, mLN, and cLP of DSS-treated WT and Ccr9−/− mice. C, The cDC subsets distribution analyses in SPL, mLN, and cLP of DSS-treated WT and Ccr9−/− mice. D, The pDC (left) and cDC (right) distribution analyses in SPL, mLN, and cLP of Rag1−/− and Rag1−/−Ccl25−/− mice transferred with WT CD45RBhi CD4+ T cells. E, The cDC subsets distribution analyses in SPL, mLN, and cLP of Rag1−/− and Rag1−/−Ccl25−/− mice transferred with WT CD45RBhi CD4+ T cells (mean ± SD). Data represent 5 pooled experiments. *P < 0.05; NS, not significant.

