
Fig. 2.
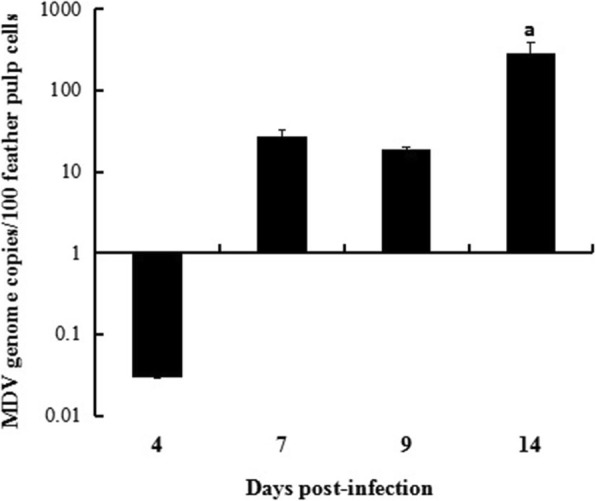
MDV load in feather tips on 4, 7, 9 and 14 d.p.i. (n = 3). Chickens were infected with MDV. Feather tips were obtained on 4, 7, 9 and 14 d.p.i., and the virus loads were measured by duplex real-time PCR. The error bars represent standard error of the mean value. The data of virus load was subjected to one-way ANOVA and then analyzed by the Tukey’s pairwise comparison to identify treatment differences, a = significant when compared to MDV-infected chickens sampled on 4, 7 and 9 d.p.i. (P < 0.05)