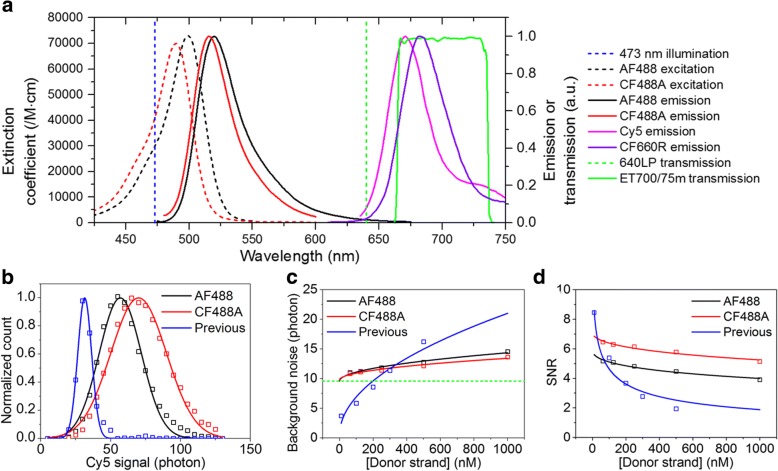
Fig. 2.
| Improved signal-to-noise ratio (SNR). (a) Excitation (dashed lines) and emission spectra (solid lines) of donor (AF488, black; CF488A, red) and acceptor (Cy5, magenta; CF660R, violet) fluorophores. The vertical blue dashed line indicates 473 nm excitation wavelength, the vertical green dashed line indicates cut-on wavelength of a 640 nm long-pass filter, and the green solid line indicates the transmission curve of a 700/75 m band-pass filter. (b) Acceptor signal of the AF488-Cy5 (black) and CF488A-Cy5 (red) pairs at 1.5 kW/cm2 excitation power recorded with an sCMOS camera and a band-pass filter. Acceptor signal of the AF488-Cy5 (blue) pair at 460 W/cm2 excitation power recorded with an EMCCD camera and a long-pass filter. The signal is defined as the amplitude of a 2D Gaussian function of each single-molecule spot. Open squares indicate measured values and solid lines indicate fitted curves with Gaussian function. The CF488A-Cy5 pair yields the higher intensity. (c) Background noise of the AF488-Cy5 (black) and CF488A-Cy5 (red) pairs at 1.5 kW/cm2 excitation power with an sCMOS camera and a band-pass filter. Background noise of the AF488-Cy5 (blue) pair at 460 W/cm2 excitation power with an EMCCD camera and a long-pass filter. The background noise is defined as the FWHM of a Gaussian function of the background signal. Open squares indicate measured values and solid lines indicate fitted curves with a square root of donor strand concentration. A band-pass filter reduces background noise significantly and CF488A-Cy5 pair yields lower background noise than AF488-Cy5 pair. Horizontal green dashed line indicates background noise without donor and acceptor strands, which is mainly caused by autofluorescence coming from a coverslip. (d) SNR of the AF488-Cy5 (black) and CF488A-Cy5 (red) pairs at 1.5 kW/cm2 excitation power recorded with an sCMOS camera and a band-pass filter and that of the AF488-Cy5 pair (blue) at 460 W/cm2 excitation power recorded with an EMCCD camera and a long-pass filter. SNR is defined as the ratio of the signal to the background noise. Open squares indicate calculated values and solid lines indicate fitted curves with an inverse square root function of donor strand concentration. The CF488A-Cy5 pair with an sCMOS camera and a band-pass filter yields the highest SNR at high donor strand concentration

