Fig. 3.

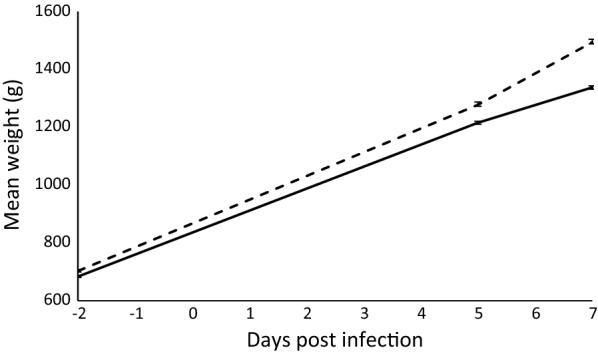
Mean weight (g) of control (n = 200, dashed-line) and infected (n = 942, solid-line) birds throughout the trial period, with standard error bars. See also (Additional file 2: Table S2) for full details

Mean weight (g) of control (n = 200, dashed-line) and infected (n = 942, solid-line) birds throughout the trial period, with standard error bars. See also (Additional file 2: Table S2) for full details