FIGURE 5:

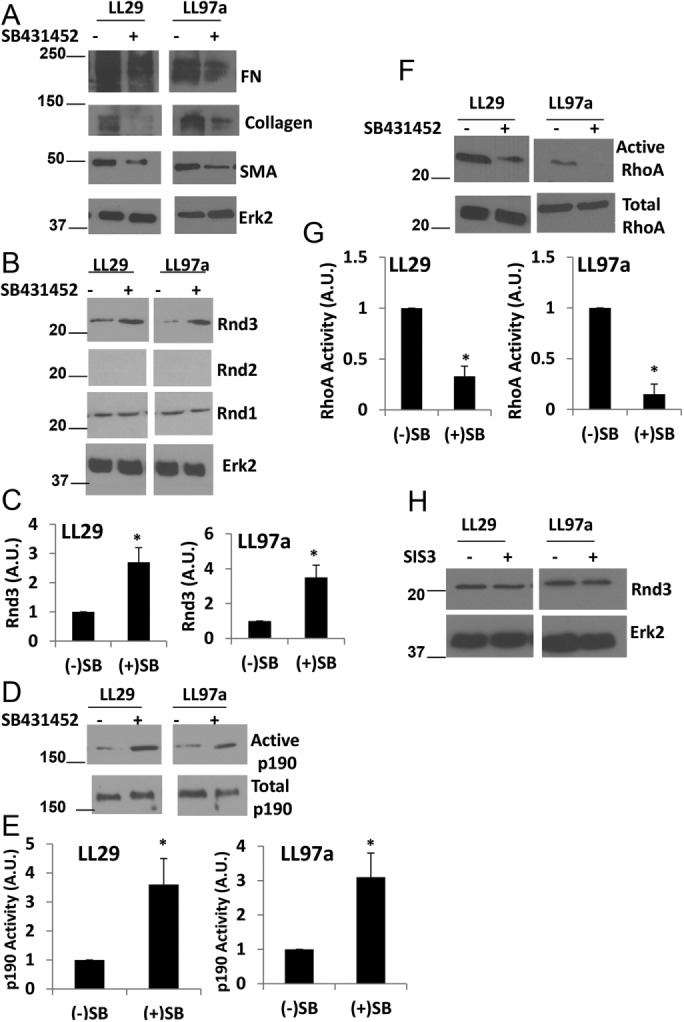
TGF-β signaling regulates the RhoA signaling pathway in IPF. Cells were treated, with or without 10 µM of the TGF-β receptor inhibitor SB431542 for 24 h. (A) LL29 and LL97a cells were lysed and levels of FN, collagen I, SMA, and Erk2 were assessed by Western blot. (B) LL29 and LL97a lysates were analyzed for expression of Rnd3, Rnd2, Rnd1, and Erk2 (loading control). (C) Quantification of Rnd3 expression from three independent experiments. (D) LL29 and LL97a cells were then analyzed for p190 activity using a GST-RhoAQ63L pull-down assay. (E) Quantification of p190 activity from three independent assays. (F) LL29 and LL97a lysates were then analyzed for the activation of RhoA measured through a GST-RBD pull-down assay as described under Materials and Methods. (G) Quantification of RhoA activity from three independent assays. (H) Cells were treated with or without the SMAD3 inhibitor SIS3 at a concentration of 10 µM for 24 h. Cells were then lysed and Rnd3 levels were evaluated by Western blot. *p < 0.05 vs. control (–) SB431542 cells as determined by a t test.
