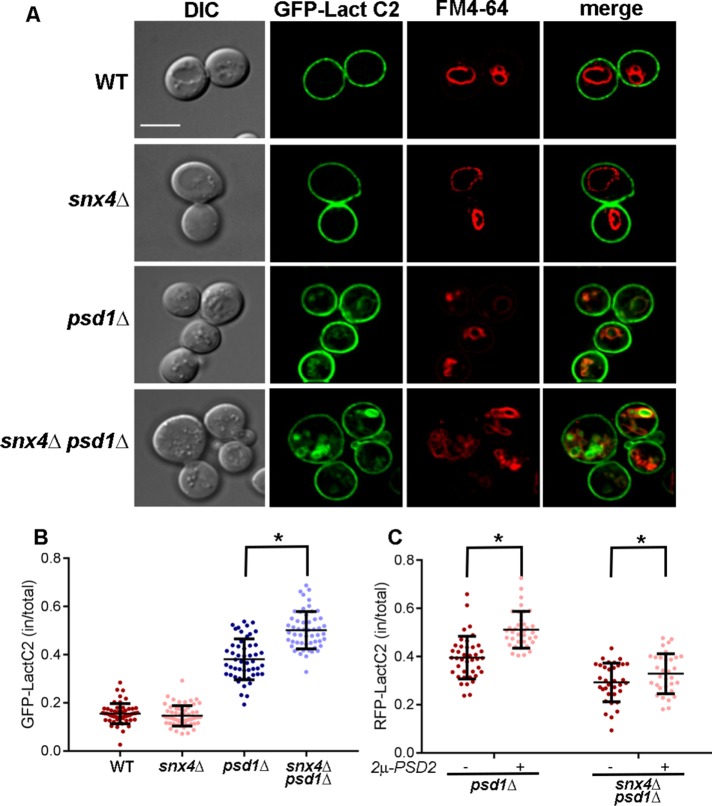
FIGURE 4:
Snx4 contributes to phosphatidylserine distribution within the endovacuolar system. (A) Micrographs (medial Z slice) of wild-type and mutant cells expressing the phosphatidylserine sensor, GFP-LactC2, are shown. Vacuoles are labeled with FM4-64. The sale bar indicates 5 μm. (B) Quantitation of GFP-LactC2 distribution. The proportion of GFP-LactC2 within the cell vs. at the cell cortex were measured. Each point is a single cell and the mean and SD are indicated. (C) Quantitation of RFP-LactC2 distribution in psd1Δ and snx4Δpsd1Δ cells with or without overexpression of PSD2. Same analysis was conducted as in B. *p < 0.0001. Standard deviations are indicated in B and C.

