FIGURE 1:
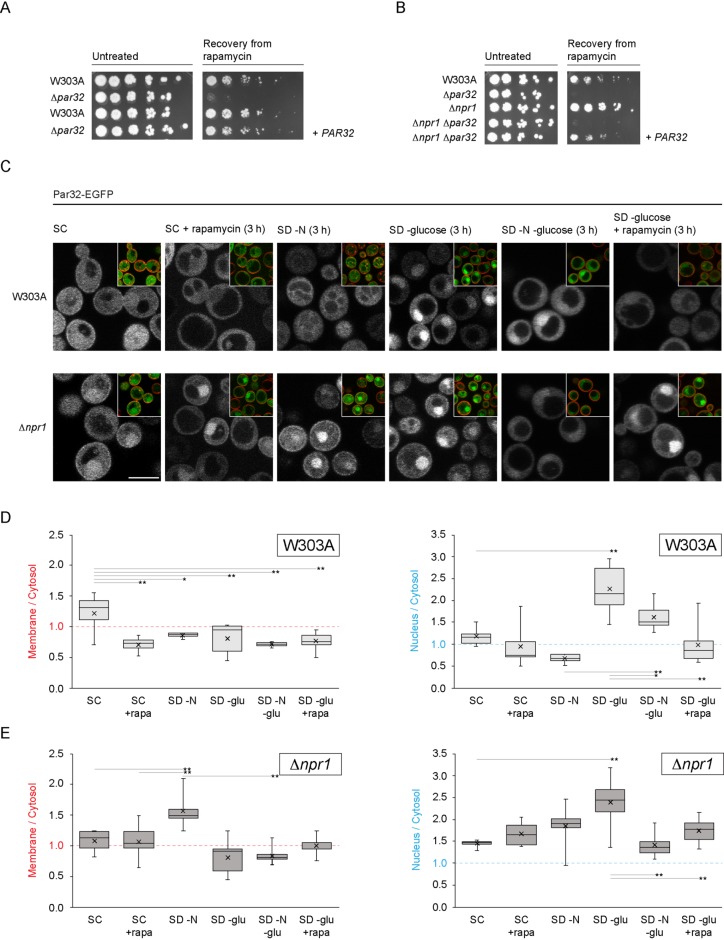
Par32 is a positive regulator of TORC1 signaling, and its subcellular localization is regulated by nutrient availability. (A) Δpar32 cells are unable to recover from exposure to rapamycin. Exponentially growing cells (OD600 0.6–0.8) were untreated or treated with rapamycin (200 ng/ml in YPD) for 5 h at 30°C. Cells were then washed and plated on YPD. Cells were imaged after incubation for 2 d at 30°C. The leftmost spot in each case corresponds to 2 μl of a culture with OD600 0.5. Spots to the right of this correspond to 2 μl of sequential fivefold dilutions. Where indicated, PAR32 was expressed from a cen/ars plasmid. (B) Resistance to rapamycin of Δnpr1 cells is mediated by Par32. Cells were treated, washed, and plated as in A. (C) Rapamycin treatment or nutrient availability effects subcellular localization of Par32-EGFP. W303A or Δnpr1 cells expressing Par32-EGFP growing under the indicated conditions for 3 h were stained with 10 μM FM 4-64 for 30 min on ice prior to visualization. The main images show the green channel (Par32-EGFP), and the insets show the same field but with the green and red (FM 4-64) channels merged. (D) Quantification of the changes in plasma membrane association or nuclear enrichment of Par32-EGFP in W303A cells. The ratios of plasma membrane to cytosolic Par32-EGFP (left chart) or of nuclear to cytosolic Par32-EGFP (right chart) were determined by quantification of the background-corrected fluorescence intensities. The boxes within the plotted data show the second and third quartiles separated by the median of the data. Whiskers show the maximum and minimum, and the mean is shown with an “x.” Differences in membrane/cytosol ratios among the different growth conditions in W303A cells were significantly heterogeneous (one-way analysis of variance [ANOVA]: F5,35 = 6.47, hence p = 0.0002). Differences in nucleus/cytosol ratios were also significantly heterogeneous (one-way ANOVA: F5,42 = 18.28, hence p = 1.33 × 10⁻⁹). Selected significantly different pairs of means, as assessed by the post-hoc Tukey HSD test, are indicated (*p < 0.05; **p < 0.01). (E) As for D but in Δnpr1 cells. Differences in membrane/cytosol ratios among the different growth conditions in Δnpr1 cells were significantly heterogeneous (one-way ANOVA: F5,39 = 10.09, hence p = 2.96 × 10⁻⁶). Differences in nucleus/cytosol ratios were also significantly heterogeneous (one-way ANOVA: F5,39 = 7.33, hence p = 6.35 × 10⁻⁵). Selected significantly different means are indicated as in D. Scale bars, 5 μm.

