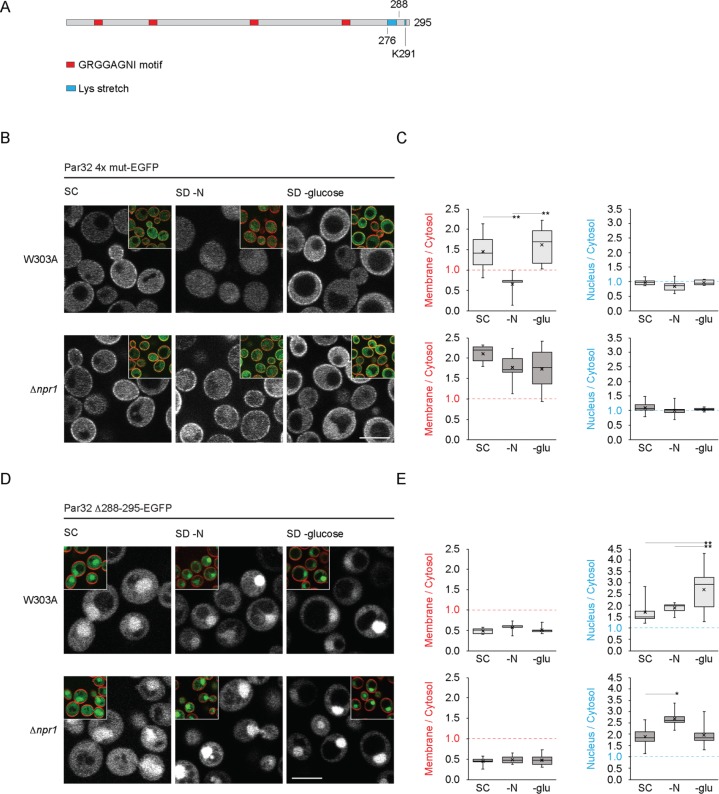
FIGURE 2:
Subcellular localizations of Par32 4x mut and Par32 Δ288-295 in W303A and Δnpr1 cells under various nutrient conditions. (A) Schematic of the primary structure of Par32 indicating, to scale, the four GRGGAGNI motifs, the lysine stretch and the position of K291. (B) W303A or Δnpr1 cells expressing Par32 4x mut-EGFP were grown, stained with FM 4-64, and imaged as in Figure 1C. (C) The ratios of plasma membrane to cytosolic Par32 4x mut-EGFP (left chart) or of nuclear to cytosolic Par32 4x mut-EGFP (right chart) were determined by quantification of the background-corrected fluorescence intensities as in Figure 1D. Differences in the Par32 4x mut-EGFP membrane/cytosol ratio among the different growth conditions in W303A were significantly heterogeneous (one-way ANOVA: W303A, F2,17 = 7.25, hence p = 0.005). Significantly different pairs of means, as assessed by the post-hoc Tukey HSD test, are indicated (*p < 0.05; **p < 0.01). Differences in means of the nucleus/cytosol ratio of W303A cells expressing Par32 4x mut-EGFP were not significant (one-way ANOVA: W303A, F2,20 = 2.00, hence p = 0.16). Differences in means of the membrane/cytosol or nucleus/cytosol ratios of Δnpr1 cells expressing Par32 4x mut-EGFP were not significant (membrane/cytosol, F2,15 = 1.28, hence p = 0.31; nucleus/cytosol, F2,21 = 0.51, hence p = 0.61). (D) W303A or Δnpr1 cells expressing Par32 Δ288-295-EGFP were treated and imaged as in B. (E) The ratios of plasma membrane to cytosolic (left charts) or nuclear to cytosolic (right charts) Par32 Δ288-295-EGFP were determined as in C. Differences in the means of the Par32 Δ288-295-EGFP membrane/cytosol ratio among the different growth conditions in W303A and Δnpr1 cells were not significant (W303A, F2,12 = 0.83, hence p = 0.46; Δnpr1, F2,16 = 0.19, hence p = 0.83). However, differences in the means of the Par32 Δ288-295-EGFP nucleus/cytosol ratios among the growth conditions in W303A and Δnpr1 cells were significant (W303A, F2,25 = 5.97, hence p = 0.008; Δnpr1, F2,15 = 4.70, hence p = 0.026). Significantly different pairs of means, as assessed by the post-hoc Tukey HSD test, are indicated (*p < 0.05; **p < 0.01). Scale bars, 5 μm.

