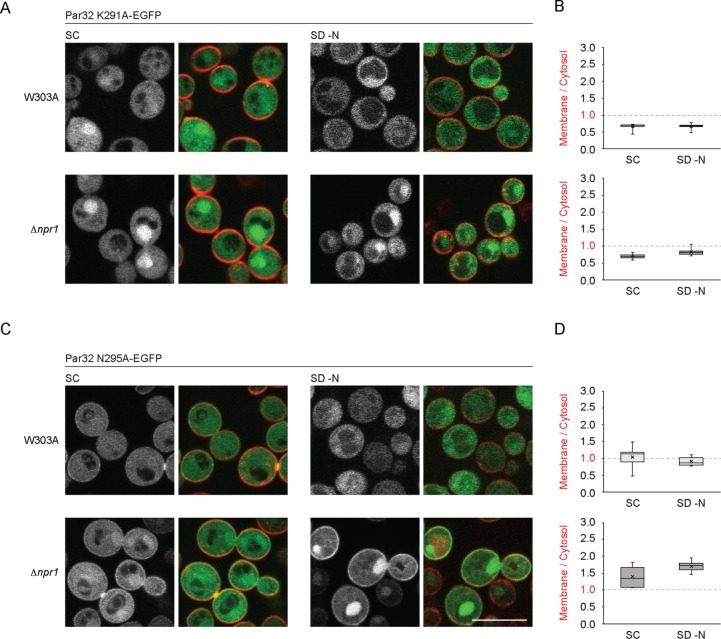
FIGURE 3:
Subcellular localizations of Par32 K291A and Par32 N295A in W303A and Δnpr1 cells under nutrient-rich and nitrogen-starvation conditions. (A, C) W303A or Δnpr1 cells expressing Par32 K291A-EGFP (A) or Par32 N295A-EGFP (C) were grown in SC or SD–N, stained with FM 4-64, and imaged as in Figure 1C. (B) The ratio of plasma membrane to cytosolic Par32 K291A-EGFP was determined as in Figure 1D. Differences in the means of the Par32 K291A-EGFP membrane to cytosol ratios when grown in SC or SD–N were not significant for W303A and Δnpr1 cells (two-tailed t test: W303A, 11 degrees of freedom, t = 0.15, hence p = 0.89; Δnpr1, 10 degrees of freedom, t = 2.19, hence p > 0.05). (D) The ratio of plasma membrane to cytosolic Par32 N295A-EGFP. Differences in the means of the Par32 N295A-EGFP membrane/cytosol ratios when grown in SC or SD–N were not significant for W303A and Δnpr1 cells (two-tailed t-test: W303A, 23 degrees of freedom, t = 1.08 hence p = 0.29; Δnpr1, 9 degrees of freedom, t = 1.91, hence p = 0.09). Scale bars, 5 μm.

