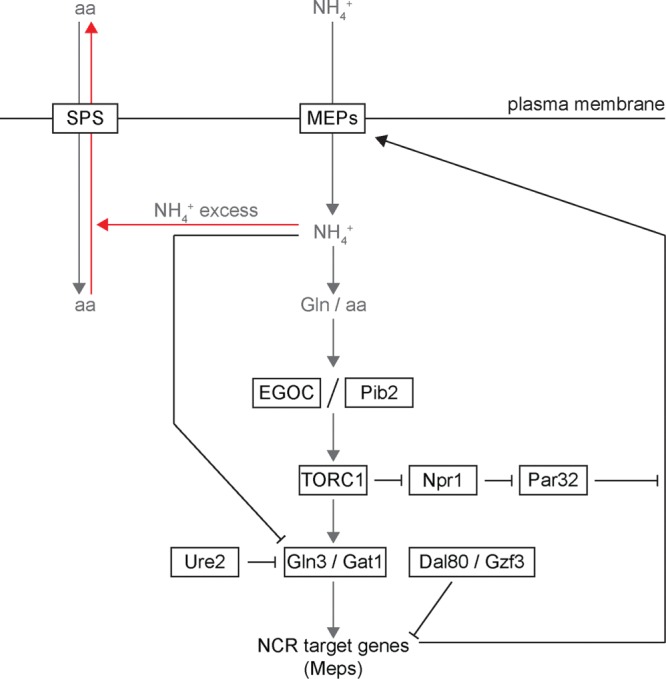
FIGURE 8:

Schematic depicting the connection between ammonium metabolism and TORC1 signaling. Abbreviations: aa, amino acids; EGOC, EGO Complex; Gln, glutamine; NH4+, ammonium ion; Meps, Mep1, Mep2, and Mep3, ammonium permeases; NCR, nitrogen catabolite repression; SPS, SPS amino acid transporters. Arrows indicate positive relationships or regulation, and blunted lines represent inhibitory relationships.
