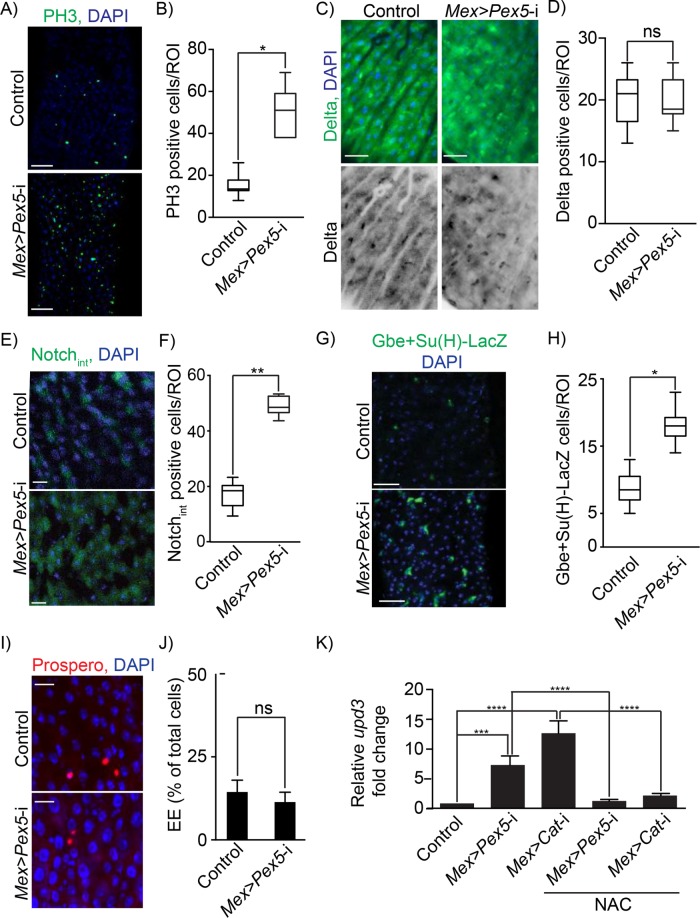
FIGURE 4:
Functional peroxisomes are required for gut epithelium homeostasis. (A) Midguts from Mex >Pex5-i flies exhibit increased numbers of dividing ISCs compared with midguts from control flies. Dividing ISCs were detected by indirect immunofluorescence of PH3 (green). DNA was stained by DAPI (blue). Scale bar, 30 μm. (B) Number of PH3-positive cells per ROI of midguts from control flies and Mex >Pex5-i flies. Values represent the median of 25 midgut ROIs ± SD for each genotype and each condition. Statistical significance was determined using two-way ANOVA; *p < 0.05. (C) Indirect immunofluorescence of Delta (green) in midguts from control flies and Mex >Pex5-i flies. DNA was stained by DAPI (blue). Scale bar, 20 μm. (D) Number of Delta-positive cells per ROI in midguts from control flies and Mex >Pex5-i flies. Values represent the median of 25 midgut ROIs ± SD. Statistical significance was determined using one-way ANOVA; ns = not significant. (E) Indirect immunofluorescence of Notchint (green) in midguts from control flies and Mex >Pex5-i flies. DNA was stained by DAPI (blue). Scale bar, 20 μm. (F) Number of Notchint-positive cells per ROI of midguts from control flies and Mex >Pex5-i flies. Values represent the median of 20 midgut ROIs ± SD. Statistical significance was determined using one-way ANOVA; **p < 0.01. (G) Indirect immunofluorescence of β-galactosidase (green) in midguts from control (Gbe+Su(H)-LacZ) flies and Mex >Pex5-i; Gbe+Su(H)-LacZ flies. DNA was stained by DAPI (blue). Scale bar, 20 μm. (H) Number of β-galactosidase positive cells per ROI of midguts from control flies and Mex >Pex5-i flies. Values represent the median of 20 midgut ROIs ± SD. Statistical significance was determined using one-way ANOVA; *p < 0.05. (I) Indirect immunofluorescence of Prospero (red) to detect EEs in midguts from control flies and Mex >Pex5-i flies. DNA was stained by DAPI (blue). Scale bar, 20 μm. (J) EEs as a percentage of all cells in midguts from control flies and Mex >Pex5-i flies. Values represent the median of 20 midgut ROIs ± SD. Statistical significance was determined using one-way ANOVA; ns = not significant. (K) Quantification of upd3 transcript in midguts from control, Mex >Pex5-i, and Mex >Cat-i flies fed cornmeal or cornmeal with 1 mM NAC, as designated. Values reported are the averages of three independent experiments ± SD. Statistical significance was determined using one-way ANOVA; ****p < 0.0001; ***p < 0.001.

