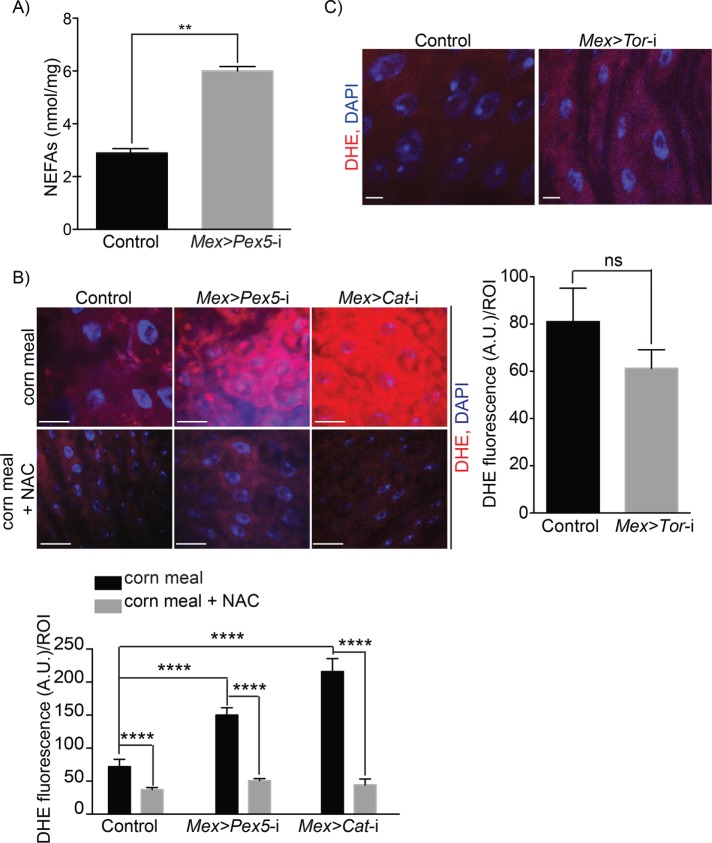
FIGURE 5:
Gut epithelium with dysfunctional peroxisomes accumulates NEFAs and exhibits increased redox stress. (A) Amounts of NEFAs in midguts from control flies and Mex >Pex5-i flies. Values reported represent the averages of three independent experiments ± SD. Statistical significance was determined using Student’s t test; **p < 0.01. (B) DHE staining (red) showing increased amounts of ROS in midguts from Mex >Pex5-i flies and Mex >Cat-i flies compared with ROS amounts in midguts from control flies (top panels). Feeding the antioxidant NAC to flies reduces ROS amounts in midguts of Mex >Pex5-i flies and Mex >Cat-i flies to amounts observed in control fly midguts (bottom panels). DNA was stained by DAPI (blue). Scale bar, 20 μm. Quantification of DHE fluorescence per ROI in midguts from flies of the reported genotypes and under the given conditions. n = 20 midguts for each genotype under each condition. Values reported represent the averages of three independent experiments ± SD. Statistical significance was determined using two-way ANOVA; ****p < 0.0001. (C) Fluorescence microscopy images of DHE staining (red) showing equal amounts of ROS in midguts from control flies (left image) and Mex >Tor-i flies (right image). DNA was stained by DAPI (blue). Scale bar, 10 μm. Quantification of DHE fluorescence per ROI of midguts of control flies and Mex >Tor-i flies. Values reported represent the average ± SD of 20 midgut ROIs for each genotype. Statistical significance was determined using one-way ANOVA; ns = not significant.

