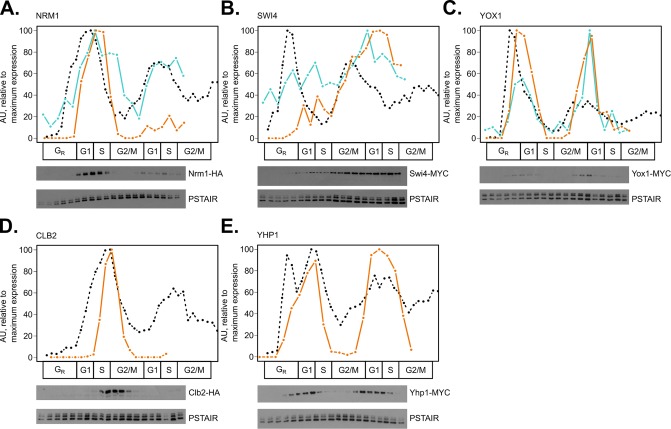
FIGURE 2:
Method validation and supplementation of targeted mass spectrometry in comparison with time series immunoblots. Line plots for mRNA expression (black, dashed), representative Western blot protein expression (orange, solid), and representative PRM peptide expression (blue, solid) were aligned on a common cell-cycle timeline using CLOCCS and plotted. Wild-type cells expressing Nrm1-HA3 (A), Swi4-13MYC (B), Yox1-13MYC (C), Clb2-HA (D), or Yhp1-13MYC (E) were grown in 2% YEPD media, synchronized by alpha-factor mating pheromone, released into YEPD, and monitored over ∼2 cell cycles. Samples were collected every 7 min for total protein extraction. Protein immunoblots were normalized to Cdc28/Pho85 (PSTAIR; constitutive levels over the cell cycle) with ImageJ. One representative Western blot is shown for each triplicate set of experiments (orange lines). To assess reproducibility between PRM and immunoblotting, Western blot data were compared with targeted mass spectrometry peptide data (blue lines) for NRM1_1 from PRM replicate 2, A; SWI4_1 from PRM replicate 1, B; and YOX1_1 from PRM replicate 1, C. Transcript expression, peptide light/heavy ratios, and Western blot data were scaled to maximum expression for each gene or protein ([0, 100] linear scale).

