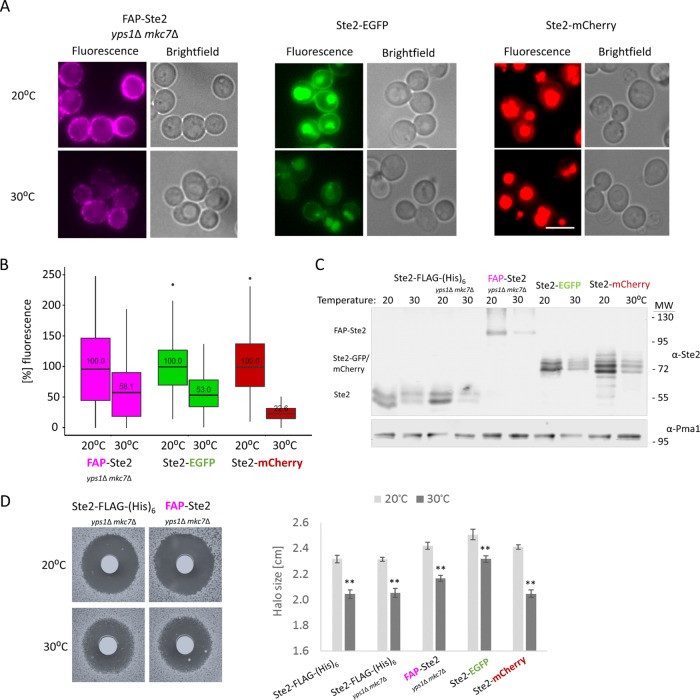
FIGURE 3:
Comparison of FAP-Ste2 to Ste2-EGFP and Ste2-mCherry at two different temperatures. (A) A MATa yps1Δ mkc7Δ strain (yAEA359) expressing FAP-Ste2 from the STE2 locus, and a MATa strain expressing Ste2-EGFP (JTY6757) and a MATa strain expressing Ste2-mCherry (YEL014) in the same manner were cultivated at either 20°C or 30°C. After incubation with fluorogen (0.4 mM dye; 15 min; pH 6.5), the cell populations were examined and compared by fluorescence microscopy. Representative images are shown for each strain and condition. Scale bar, 5 μm. (B) For the cell samples in A, PM-localized fluorescence was quantified (n > 250 cells each) using CellProfiler, and the values obtained were plotted in box-and-whisker format. Box represents the interquartile range (IQR) between lower quartile (25%) and upper quartile (75%); horizontal black line represents the median value; whisker ends represent the lowest and highest data points still within 1.5 IQR of the lower and upper quartiles, respectively; dot, a single cell that exhibited a fluorescence intensity higher than the upper quartile. For each strain, the initial median fluorescence intensity value at the PM obtained at 20°C was set to 100%. (C) The strains in A, as well as wild-type cells expressing Ste2-FLAG-(His)6 (yAEA201) and an otherwise isogenic yps1Δ mkc7Δ strain expressing Ste2-FLAG-(His)6 (yAEA361), were cultivated at either 20°C or 30°C, and extracts were prepared and samples (6 μg total protein) analyzed as in Figure 2B. (D) Left, the pheromone responsiveness of the indicated cultures from C was assessed using an agar diffusion (halo) bioassay to measure α-factor-induced growth arrest on BSM medium (15 μg α-factor spotted on each filter disk). Plates were incubated at the indicated temperature. Right, quantification of the average difference in halo diameter for the indicated strains (two biological and three technical replicates were performed for each) at 20° and 30°C. Error bars, SEM; **p value < 0.0001, determined by two-tailed Student’s t test.

