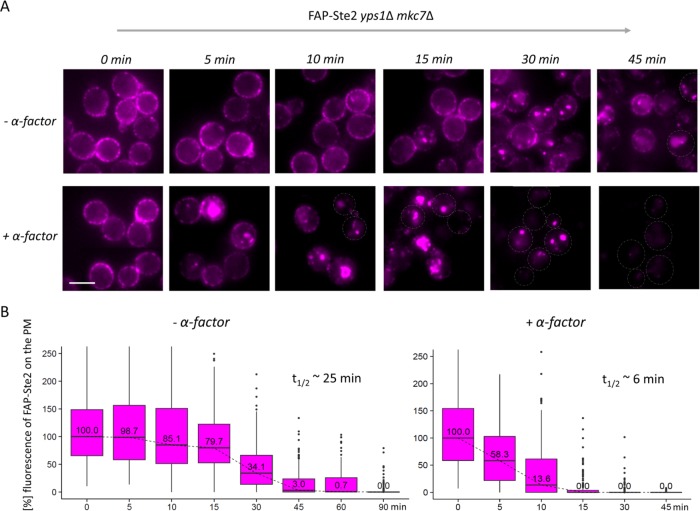
FIGURE 4:
Direct visualization of basal and ligand-induced receptor internalization. (A) A MATa yps1Δ mkc7Δ strain expressing FAP-Ste2 (yAEA359) was grown at 20°C to early exponential phase, treated with LatA, incubated with fluorogen (0.4 mM dye; 15 min; pH 6.5), and deposited onto the glass bottoms of imaging chambers, and then internalization was initiated by washing out the LatA and excess fluorogen, as described under Materials and Methods, followed by either immediate addition of α-factor in H2O (5 μM final concentration) (+α-factor) or an equivalent of water (–α-factor), and the cells were monitored by fluorescence microscopy at the indicated times over the course of 45–90 min. A representative image is shown for each time point. Scale bar, 5 μm. (B) The fluorescence intensity at the cell periphery in cells from the images (n = 5–6 per time point) from A were quantified using CellProfiler and plotted in box-and-whisker format, as in Figure 3B. For each strain, the initial median fluorescence intensity value at the PM was set to 100%. Insets, calculated times (t1/2) for 50% decrease in PM fluorescence.

