FIGURE 8:
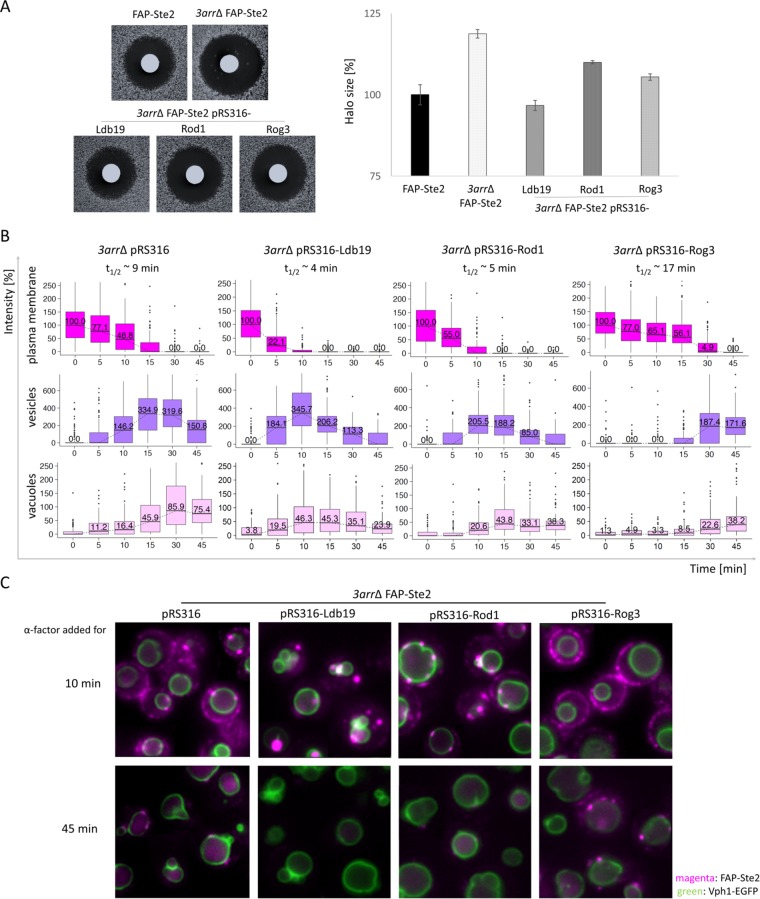
Ldb19, Rod1, and Rog3 have distinct roles in Ste2 down-regulation. (A) Left, the halo bioassay for pheromone-induced growth arrest was used to assess the relative pheromone sensitivity of a MATa yps1Δ mkc7Δ FAP-Ste2 Vph1-EGFP strain (yAEA380) and an otherwise isogenic 3arr∆ derivative (yAEA389), both carrying empty vector (pRS316) (top panels), as well as the same 3arr∆ strain expressing LDB19, ROD1, or ROG3, as indicated, from the same vector (bottom panels), as in Figure 3D, except that the medium was BSM-Ura and 15 μg α-factor were spotted on the filter disks. Right, results of independent experiments (n = 6) are plotted as a bar graph, as in Figure 3D. (B) The same strains as in A were labeled with fluorogen, exposed to α-factor, and examined by fluorescence microscopy, as in Figure 3A, and the data were analyzed and plotted as in Figure 6B. The initial intensities of FAP-Ste2 on the PM (i.e., at time 0) were very similar for all four strains, and their median values were set to 100%; t1/2, calculated time for 50% decrease in PM fluorescence. (C) Representative images for the strains in B at the indicated time points. Scale bar, 2.5 μm.

