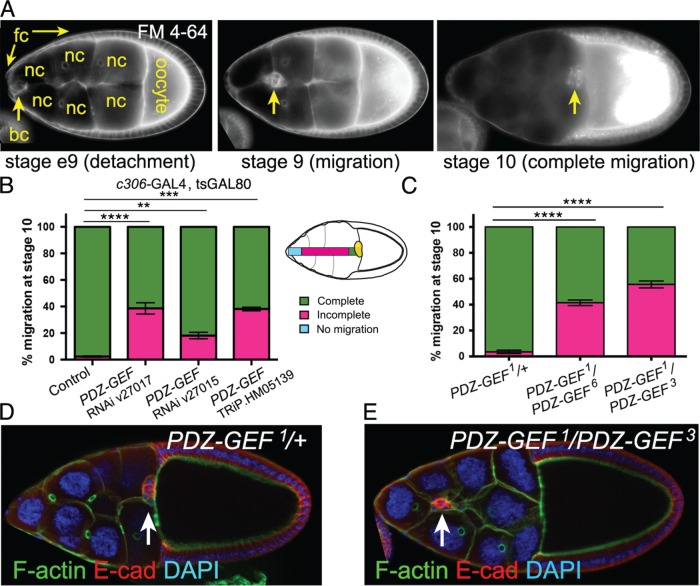
FIGURE 1:
PDZ-GEF is required for border cell migration. (A) Wild-type border cell migration at the indicated ovarian developmental stages. Frames from live time-lapse videos of wild-type egg chambers stained for the lipophilic dye FM 4-64. Border cells (bc; arrows) detach from the follicle cell (fc) epithelium at early stage 9 (e9), migrate between the 15 nurse cells (nc) at stage 9, and reach the large oocyte at the posterior by stage 10. (B) PDZ-GEF RNAi knockdown prevents border cell migration. Quantification of border cell migration at stage 10, shown as the percentage of complete (green), incomplete (pink), or no (blue) border cell migration in control (c306-GAL4, tsGAL80/+) and PDZ-GEF RNAi (c306-GAL4, tsGAL80/+; +/PDZ-GEF RNAi) egg chambers, using three PDZ-GEF RNAi lines: 27017, 27105, and TRiP.HM05139. The egg chamber schematic illustrates the migration distance categories (no migration, incomplete, complete) of border cells (yellow). Values consist of four trials, with each trial assaying n ≥ 75 egg chambers (total n ≥ 310 egg chambers per genotype); **p < 0.01; ***p < 0.001; ****p < 0.0001; unpaired two-tailed t test comparing “complete” migration. (C) Loss of PDZ-GEF, using strong transallelic combinations of mutant alleles (Lee et al., 2002; Singh et al., 2006; Wang et al., 2006), disrupts border cell migration. Quantification of migration at stage 10, as shown in B. Genotypes: PDZ-GEF1/+ (control), PDZ-GEF1/PDZ-GEF6, and PDZ-GEF1/PDZ-GEF3. Values consist of five trials, with each trial assaying n ≥ 50 egg chambers (total n ≥ 255 egg chambers per genotype); ****p < 0.0001; unpaired two-tailed t test comparing “complete” migration. Error bars in B and C: ± SEM. (D, E) Loss of PDZ-GEF impairs border cell migration. E-cadherin (E-cad; red) labels cell membranes of border cells (arrows) and follicle cells, phalloidin (green) labels F-actin and DAPI (blue) labels nuclear DNA in stage 10 PDZ-GEF1/+ (control, D) and PDZ-GEF1/PDZ-GEF3 mutant (E) egg chambers. Anterior is to the left in this and all following figures.

