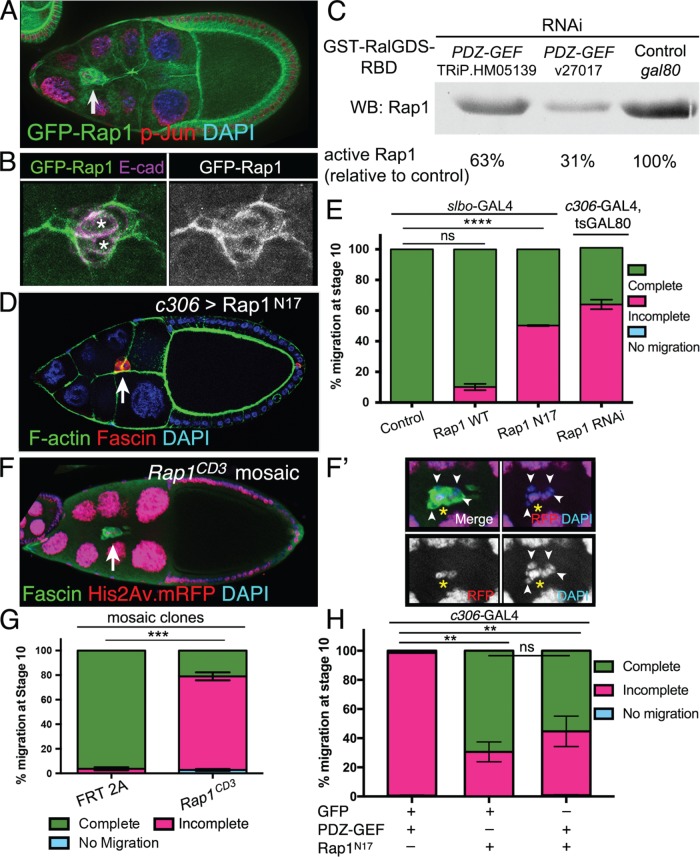
FIGURE 2:
Rap1 is regulated by PDZ-GEF and is required for border cell migration. (A, B) GFP-Rap1 is expressed in border cells. Representative examples of stage 9 egg chambers expressing GFP-Rap1 (green) and costained for DAPI (blue in A) to label nuclear DNA, phospho-Jun (red in A) to label nuclei, or E-cadherin (E-cad; magenta in B) to label cell membranes. (A) Arrow points to border cells. GFP-Rap1 is also expressed in follicle cells and nurse cells. (B) Close-up view of a border cell cluster showing that GFP-Rap1 is membrane-enriched and partly colocalizes with E-cadherin in border cells and polar cells (left panel: asterisks; colocalization in white). (C) Activity pull-down assay demonstrates that PDZ-GEF regulates Rap1 activity in Drosophila S2 cells. GST-RalGDS-RBD beads were used to pull down GTP-bound active Rap1 from S2 cells in the presence of wild-type levels of PDZ-GEF (control gal80 RNAi) or when PDZ-GEF was knocked down (v27107 and TRiP.HM05139 RNAi; see Materials and Methods). The relative amount of active Rap1 pulled down was identified by Western blot using a Rap1 antibody. Relative band intensities were measured as a percentage of the control, which represents the amount of maximally active Rap1 in this assay. (D, E) Inhibition of Rap1 activity by dominant-negative Rap1 (Rap1N17) or knockdown by RNAi disrupts border cell migration. (D) Expression of Rap1N17 disrupts border cell migration. Example of a stage 10 c306>Rap1N17 egg chamber (c306-GAL4 tsGAL80/+; UAS-Rap1N17/+) stained for Fascin (red) to label border cells (arrow), phalloidin to label F-actin (green) and DAPI (blue) to label nuclear DNA. (E) Quantification of complete (green), incomplete (pink), and no (blue) migration in stage 10 control (slbo-Gal4/+), Rap1WT (slbo-Gal4/+; +/UAS-Rap1WT), Rap1N17 (slbo-Gal4/UAS-Rap1N17), and Rap1 RNAi (c306-Gal4 tsGAL80/+; +/UAS-Rap1 RNAi v33437) egg chambers. Migration distance as in Figure 1B. Values consist of five trials, with each trial assaying n ≥ 50 egg chambers (total n ≥ 250 egg chambers per genotype); ns, not significant, p ≥ 0.05; ****p < 0.0001; unpaired two-tailed t test comparing “complete” migration. (F, F′) Rap1 mosaic mutant border cells do not complete their migration to the oocyte. Stage 10 Rap1CD3 mosaic mutant egg chamber stained for Fascin (green) to label the border cells (arrow) and DAPI (blue) to visualize nuclear DNA. His2Av.mRFP (red fluorescent protein, RFP; red) marks wild-type cells; colocalization with DAPI appears as magenta. Loss of RFP marks the homozygous mutant cells, including border cells (arrowheads in F′). (F′) Magnified view of the Rap1CD3 mosaic mutant border cell cluster from (F). Three cells, likely the pair of polar cells (yellow asterisk) and one border cell, are wild-type (red), while the remaining border cells are mutant (loss of red fluorescence). (G) Extent of migration when border cells are mosaic mutant for a loss-of-function allele of Rap1. Quantification of complete (green), incomplete (pink), and no (blue) migration in stage 10 control (FRT 2A) and Rap1CD3 FRT 2A mosaic mutant egg chambers. Migration distance as in Figure 1B. Values consist of four trials, with each trial assaying n ≥ 75 egg chambers (total n ≥ 300 egg chambers per genotype); ***p = 0.0001; unpaired two-tailed t test comparing “complete” migration. (H) Expression of Rap1N17 partially suppresses the migration defects caused by PDZ-GEF overexpression. Quantification of complete (green), incomplete (pink), and no (blue) migration in stage 10 egg chambers expressing PDZ-GEF and GFP (c306-GAL4/+; UAS-PLC∆PH-GFP/UAS-PDZ-GEF), Rap1N17 and GFP (c306-GAL4/+; UAS-Rap1N17/+; +/UAS-PLC∆PH-GFP), or Rap1N17 and PDZ-GEF (c306-GAL4/+; UAS-Rap1N17/+; +/UAS-PDZ-GEF). Values consist of three trials, with each trial assaying n ≥ 42 egg chambers per genotype (total n ≥ 176 egg chambers per genotype); ns, p ≥ 0.05; **p < 0.01; one-way analysis of variation (ANOVA) comparing “incomplete” migration. Error bars in E, G, and H: ± SEM.

