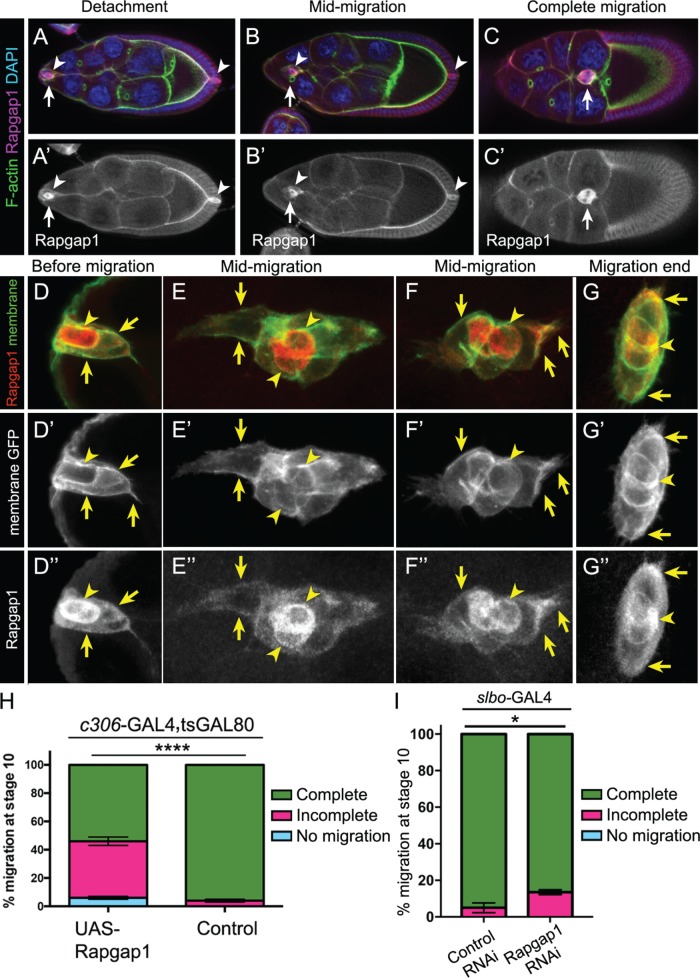
FIGURE 4:
Rapgap1 is important for border cell migration. (A–G″) Rapgap1 protein expression and subcellular localization during the stages of oogenesis when border cells migrate. Wild-type egg chambers stained for Rapgap1 (magenta, A–C; red, D–G; white, A′–C′, D″–G″), DAPI to visualize nuclear DNA (blue, A–C), and costained for phalloidin to label F-actin (green, A–C) or expressing UAS-PLC∆PH:GFP to visualize cell membranes (green in D–G and white in D′–G′). (A–C′) Rapgap1 is expressed in anterior and posterior polar cells (arrowheads), as well as border cells (arrows), throughout the stages when border cells migrate, from detachment to complete migration. (D–G″) Close-up view of border cells coexpressing membrane-GFP and Rapgap1. Rapgap1 levels are highest in polar cells (arrowheads) at the start of migration (D, D‴) and at mid-migration stages (E, E‴, F, and F‴). By the end of migration, polar cells and border cells exhibit more equivalent levels of Rapgap1 (G, G‴). Rapgap1 exhibits diffuse subcellular localization in the cytoplasm and at cell membranes of border cells (arrows, D–G‴) and polar cells (arrowheads, D–G‴). The colocalization of Rapgap1 with membrane-GFP was confirmed by measuring normalized pixel intensities across border cell (arrows) and polar cell (arrowheads) membranes using the “plot profile” feature of FIJI (see Materials and Methods and Supplemental Figure 3, F and G). Maximum intensity projections of four to six merged z-stack sections are shown here but were not used for quantification. The direction of migration is to the right. (H, I) Raising or lowering the levels of Rapgap1 in border cells impairs migration. Quantification of complete (green), incomplete (pink), and no (blue) migration in stage 10 egg chambers. (H) Overexpression of Rapgap1 in border cells and polar cells driven by c306-GAL4. Genotypes are as follows: control (c306-GAL4, tsGAL80/+) and UAS-Rapgap1 (c306-GAL4, tsGAL80/+; +/UAS-Rapgap1). Migration distance as in Figure 1B. Values consist of four trials, with each trial assaying n ≥ 50 egg chambers (total n ≥ 230 egg chambers per genotype); ****p < 0.0001; unpaired two-tailed t test comparing “complete” migration. (I) Rapgap1 RNAi in border cells driven by slbo-GAL4. Genotypes are control (slbo-GAL4/UAS-mCherry RNAi) and Rapgap1 RNAi (slbo-GAL4/UAS-Rapgap1 RNAi v102659). Values consist of three trials, with each trial assaying n ≥ 44 egg chambers (total n ≥ 186 egg chambers per genotype); *p = 0.016; unpaired two-tailed t test comparing “incomplete” migration. Error bars in H and I: ± SEM.

