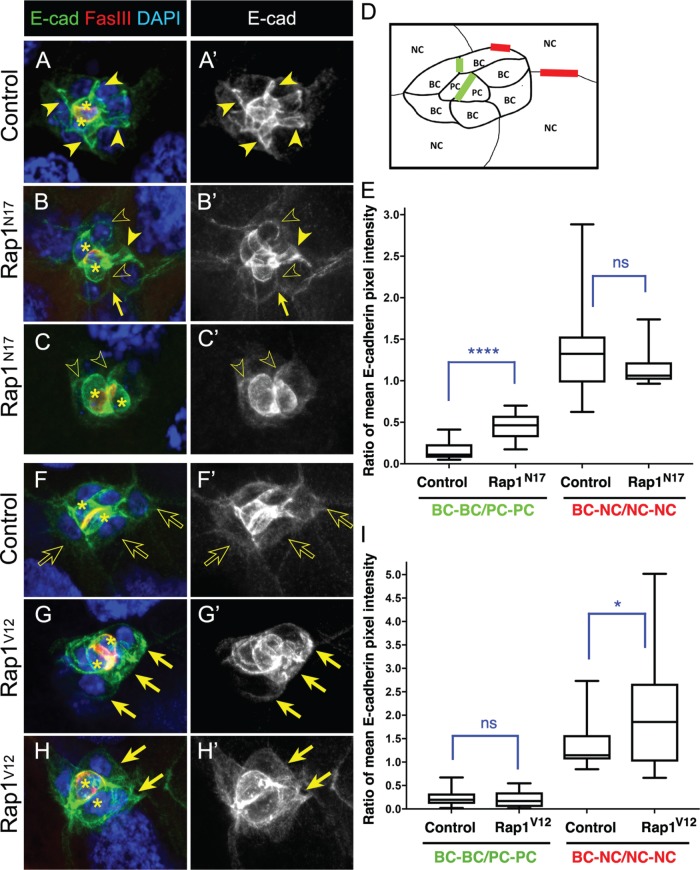
FIGURE 5:
Rap1 regulates E-cadherin levels at specific cell–cell junctions. (A–C′, F–H′) Representative stage 9 control (A, A′, F, F′), stage 10 Rap1N17 (B–C’), and stage 10 Rap1V12 (G–H′) border cell clusters stained for E-cadherin (green in A–C and F–H; white in A′–C′ and F′–H′), Fas III to label the central polar cells (red in A–C and F–H; colocalization with E-cadherin appears yellow), and DAPI to visualize nuclear DNA (blue in A–C and F–H). Polar cells are marked with asterisks in A–C and F–H. The direction of migration is to the right in all panels. Maximum intensity projections of five merged z-stack sections are shown. (A–C′) Solid arrowheads mark high E-cadherin expression at border cell–border cell (BC-BC) junctions; open arrowheads indicate lower E-cadherin at BC-BC junctions. Arrows in B and B′ indicate altered contacts between border cells. (F–H′) Solid arrows mark high E-cadherin expression at BC-nurse cell (NC) junctions; open arrows indicate low E-cadherin at BC-NC junctions. (D) Schematic of a migrating border cell cluster showing cell–cell contacts measured for E-cadherin mean pixel fluorescence intensity in E and I; BC-BC and PC-PC (green) and BC-NC and NC-NC (red). (E, I) Quantification, represented as box-and-whisker plots, of the mean pixel intensity of E-cadherin as a ratio of BC-BC/PC-PC (green) and BC-NC/NC-NC (red) in matched control and Rap1N17 egg chambers (E) and matched control and Rap1V12 egg chambers (I). The whiskers represent the minimum and maximum pixel intensity; the box extends from the 25th to the 75th percentiles; the line indicates the median. ns, not significant (p ≥ 0.05); *p < 0.05; ****p < 0.0001; two-tailed unpaired t test. Genotypes are as follows: matched controls (c306-GAL4 tsGal80/+; UAS-PLC-∆PH-GFP/+ in A and A′; slbo-GAL4, UAS-mCD8-GFP/+ in D and D′); Rap1N17 (c306-GAL4 tsGal80/+; +/UAS-Rap1N17); Rap1V12 (slbo-GAL4/+; UAS-Rap1V12/+). (E) For control, 31 BC-BC contacts and 22 BC-NC contacts were measured from 15 border cell clusters. For Rap1N17, 22 BC-BC contacts were measured from 12 border cell clusters and 24 BC-NC contacts were measured from 11 border cell clusters. (I) For control, 40 BC-BC contacts and 22 BC-NC contacts were measured from 20 border cell clusters. For Rap1V12, 46 BC-BC contacts and 30 BC-NC contacts were measured from 25 border cell clusters.

