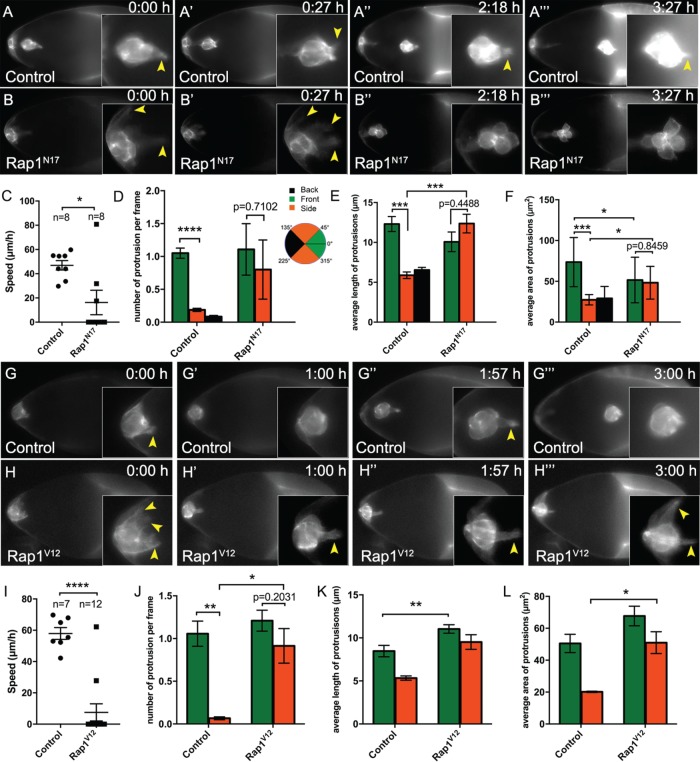
FIGURE 6:
Rap1 promotes collective motility and the proper formation of a single lead protrusion. (A–B‴, G–H‴) Frames from matched control (A–A‴; Supplemental Video 1) and Rap1N17 (B–B‴; Supplemental Video 2), and matched control (G–G‴; Supplemental Video 4) and Rap1V12 (H–H‴; Supplemental Video 5) live time-lapse videos showing migrating border cells (slbo-LifeAct-GFP) at the indicated times (h:min). Insets, close-up views of the same border cell clusters from the indicated video frame. Arrowheads indicate protrusions. (A–A‴, G–G‴) Representative control border cell clusters with major front protrusions. Cells within the cluster stay tightly cohesive throughout migration. (B–B‴) Representative Rap1N17 border cell cluster with multiple protrusions during early migration (B, B′). Later, the border cells become round (B″ and B‴). (H-H‴) Representative Rap1V12 border cell cluster that failed to initiate migration. Border cells remain at the anterior of the egg chamber. Multiple “side” protrusions extend (H, H‴), in addition to prominent “front” protrusions (H′, H″). (C, I) Measurement of migration speed in individual videos. (C) Matched control (n = 8) and Rap1N17 (n = 8). (I) Matched control (n = 7) and Rap1V12 (n = 12). (D–F, J–L) Measurements of protrusions within the first hour of matched control and Rap1N17 (D–F) and matched control and Rap1V12 (J–L) videos. (D, J) Number of protrusions from migrating clusters, per frame of the video, at the front, back, or side of the cluster. (E, F, K, L) Quantification of the average length (E, K) and average area (F, L) of protrusions from time-lapse videos of the indicated genotypes. See Supplemental Figure 4A for a schematic showing how protrusion length and area were measured. (D–F) N = 8 videos for control: 22 front protrusions, 7 side protrusions, and 3 back protrusions were analyzed; n = 7 videos for Rap1N17: 16 front protrusions and 3 side protrusions were analyzed; no back protrusions were observed. (J–L) N = 7 videos for control: 19 front protrusions and 3 side protrusions were analyzed; n = 12 videos for Rap1V12: 26 front protrusions and 12 side protrusions. Error bars: SEM; *p < 0.05; **p < 0.01; ***p < 0.001; ****p < 0.0001; all other values were not significant (p ≥ 0.05), with the exception of D, E, F, and J, where the p values are shown to compare front and side protrusions within the same genotype; unpaired two-tailed t test. (A–F) Genotypes: control (c306-GAL4, tsGal80/+; +/slbo-LifeAct-GFP) and Rap1N17 (c306-GAL4, tsGal80/+; UAS-Rap1N17/slbo-LifeAct-GFP). (G–L) Genotypes: control (slbo-GAL4/slbo-LifeAct-GFP) and Rap1V12 (slbo-GAL4/slbo-LifeAct-GFP; +/UAS-Rap1V12).

