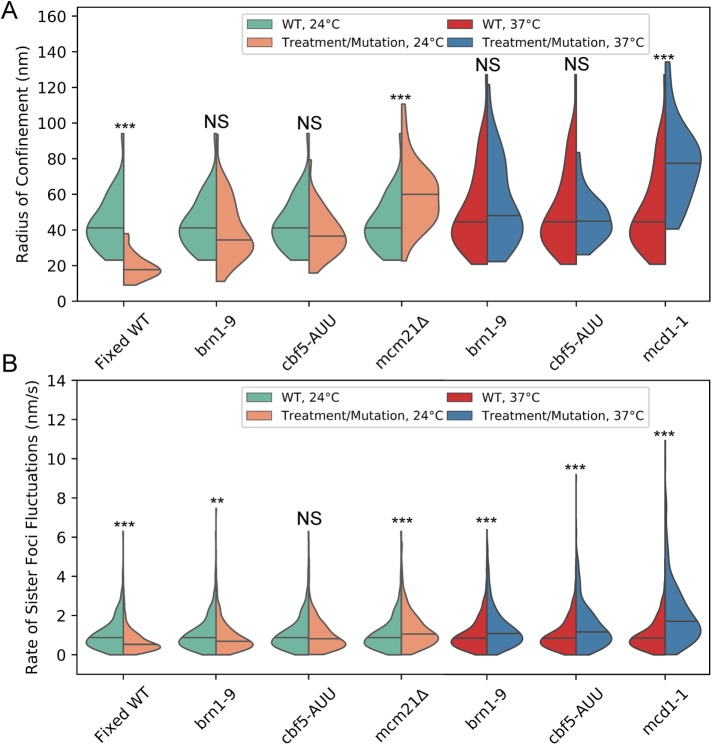
FIGURE 2:
Cohesin confines pericentric chromatin while both cohesin and condensin limit rate of sister foci fluctuations. (A) Violin plot of the radii of confinement of the 10-kb lacO/LacI-GFP array in the pericentric region during metaphase (generated from the same data as Figure 1, B and C). The black line represents the median and the colored shapes are a smoothed histogram of the distribution of each strain’s radii of confinement. Wilcoxon rank-sum test (two-sided) p values compared with WT at corresponding temperature: Fixed WT 24°C = 2 × 10⁻¹², brn1-9 24°C = 0.2, cbf5-AUU 24°C = 0.1, mcm21Δ 24°C = 2 × 10⁻⁵, brn1-9 37°C = 0.4, cbf5-AUU 37°C = 0.8, and mcd1-1 37°C = 7 × 10⁻⁷. (B) Violin plot of the rate of sister foci fluctuations. WT 24°C, n = 459; fixed WT 24°C, n = 538, brn1-9 24°C, n = 546; cbf5-AUU 24°C, n = 447; mcm21Δ 24°C, n = 459; WT 37°C, n = 605; and brn1-9 37°C n = 543, cbf5-AUU 37°C, n = 620; and mcd1-1, 37°C, n = 482; persistent motion events. Wilcoxon rank-sum test (two-sided) p values compared with WT at corresponding temperature: Fixed WT 24°C = 1 × 10⁻¹⁵, brn1-9 24°C = 0.002, cbf5-AUU 24°C = 0.4, mcm21Δ 24°C = 9 × 10⁻⁶, brn1-9 37°C = 2 × 10⁻⁸, cbf5-AUU 37°C = 6 × 10⁻¹², and mcd1-1 37°C = 8 × 10−41. Multiple comparisons of WT data (four for 24°C and three for 37°C) to mutants was corrected using the Bonferroni correction (see Materials and Methods) such that NS is p ≥ 0.05/number of comparisons, ** is p < 0.01/number of comparisons, and *** is p < 0.001/number of comparisons.

