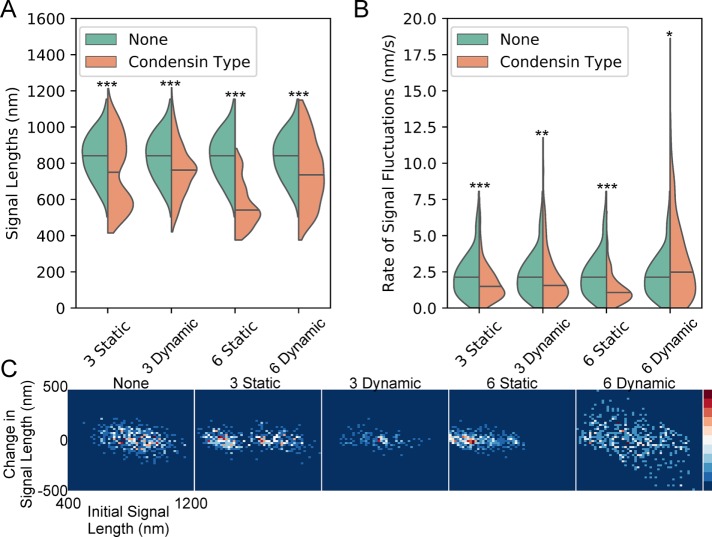
FIGURE 6:
Static and dynamic condensin-mediated loops compact and alter fluctuation rate of simulated dicentric plasmids. (A) Violin plot of simulated signal lengths. The black line is the median of the distribution and the colored shapes are smoothed histograms of the distribution of simulated signal length for each simulation type. Each simulation type was repeated 10 times using different random seeds. A simulated image stack was generated every 30 s from each simulation (assuming a nuclear viscosity of 141 P; see Materials and Methods) and the signal length was measured using the same analysis as for the experimental images. None, n = 470; three static condensins, n = 470; three dynamic condensins, n = 478; six static condensins, n = 470; and six dynamic condensins, n = 480 simulated plasmid signals. Wilcoxon rank-sum test (two-sided) p values compared with none: three static condensins = 1 × 10⁻¹³, three dynamic condensins = 1 × 10⁻¹⁷, six static condensins = 4 × 10−113, and six dynamic condensins = 2 × 10⁻¹⁶. (B) Violin plot of simulated rates of signal fluctuations. The black line is the median of the distribution and the colored shapes are smoothed histograms of the distribution of the rates of signal fluctuations for each simulation type. None, n = 261; three static condensins, n = 310; three dynamic condensins, n = 342; six static condensins, n = 337; and six dynamic condensins, n = 360 fluctuation rates. Wilcoxon rank-sum test (two-sided) p values compared with none: three static condensins = 1 × 10⁻⁶, three dynamic condensins = 0.001, six static condensins = 2 × 10⁻¹⁹, and six dynamic condensins = 0.005. Bonferroni correction applied to simulation comparisons. (C) Probability density maps of change in simulated signal length as a function of initial simulated signal length.

