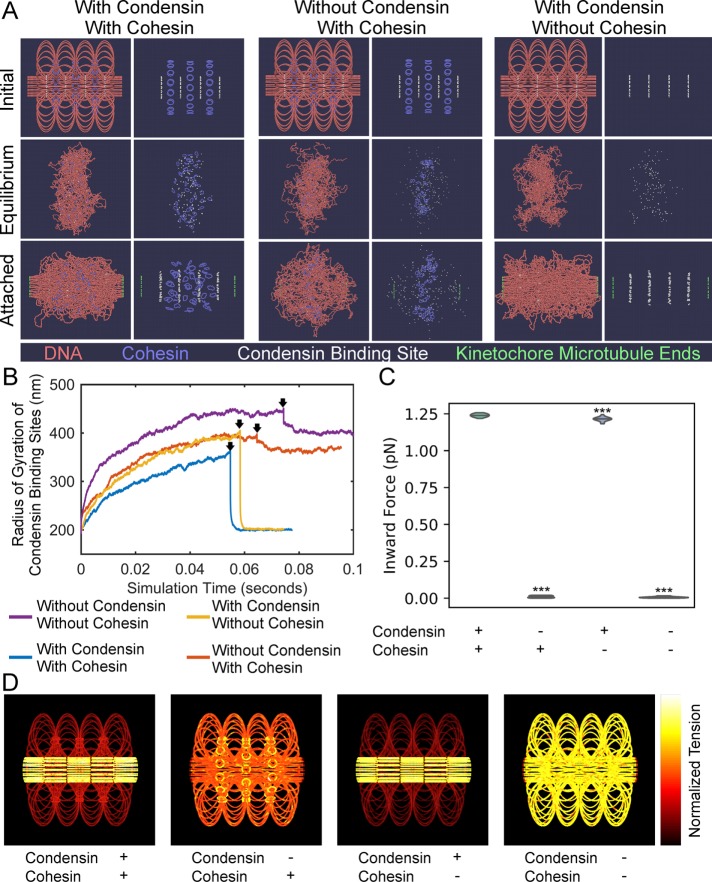
FIGURE 7:
Condensin creates two force regimes in chromatin. (A) ChromoShake simulations of pericentromeres with or without cohesin and condensin. Initial configurations are in the top panel. Centromeres, the leftmost and rightmost beads, are separated by 800 nm. Middle panels correspond to timepoints indicated by black arrows in B. The bottom panels correspond to final timepoints in B. Each panel is also shown without DNA for clarity. Condensin-binding sites are in white and are shown in each panel. (B) Line plots of radius of gyration of condensin -binding sites over simulation time. Black arrows indicate timepoints before attachment to kinetochore microtubules is introduced. (C) Violin plot of inward force in pericentromere simulations with permanent attachment to kinetochore microtubules with or without cohesin and/or condensin. The black line is the median of the distribution and the colored shapes are smoothed histograms of the distribution of the inward forces for each simulation type. All simulations contained n = 16 sister centromere pairs. Wilcoxon rank-sum test (two-sided) p values as compared with simulation with condensin and with cohesin: without condensin and with cohesin = 2 × 10⁻⁶, with condensin and without cohesin = 5 × 10⁻⁵, and without condensin and without cohesin = 2 × 10⁻⁶. (D) Initial configurations of pericentromere simulations with permanent attachment to kinetochore microtubules where DNA beads are colored based on the mean tension on that bead after the simulation has run for 0.05 s of simulation time. The bead with the most tension in each simulation is white, whereas the bead with the lowest tension is black. The leftmost and rightmost beads are not shown.

