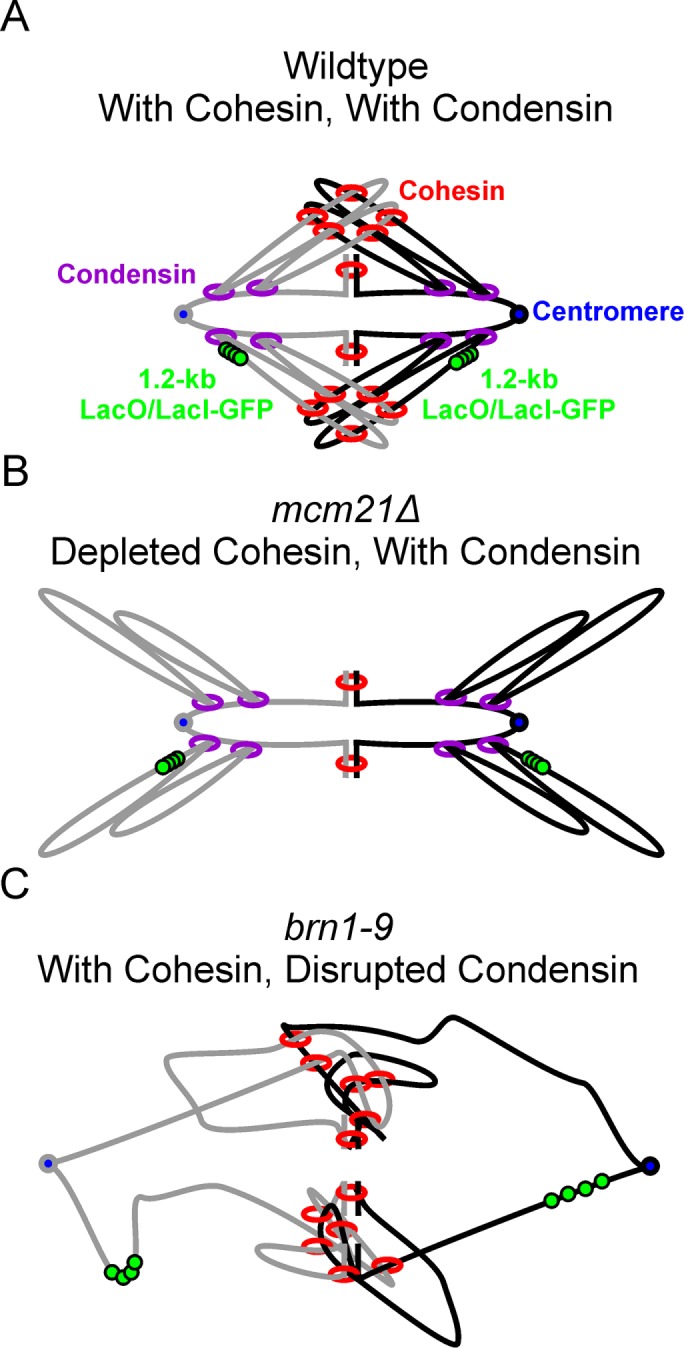
FIGURE 8:

Models of WT, mcm21Δ, and brn1-9 pericentric regions. Models of the pericentric region during metaphase (sister strands are gray and black) labeled with the 1.2-kb lacO/LacI-GFP array (green) centered 1.7 kb from the centromere (blue) with either both cohesin (red) and condensin (purple; A), depleted cohesin (B), or disrupted condensin (C).
