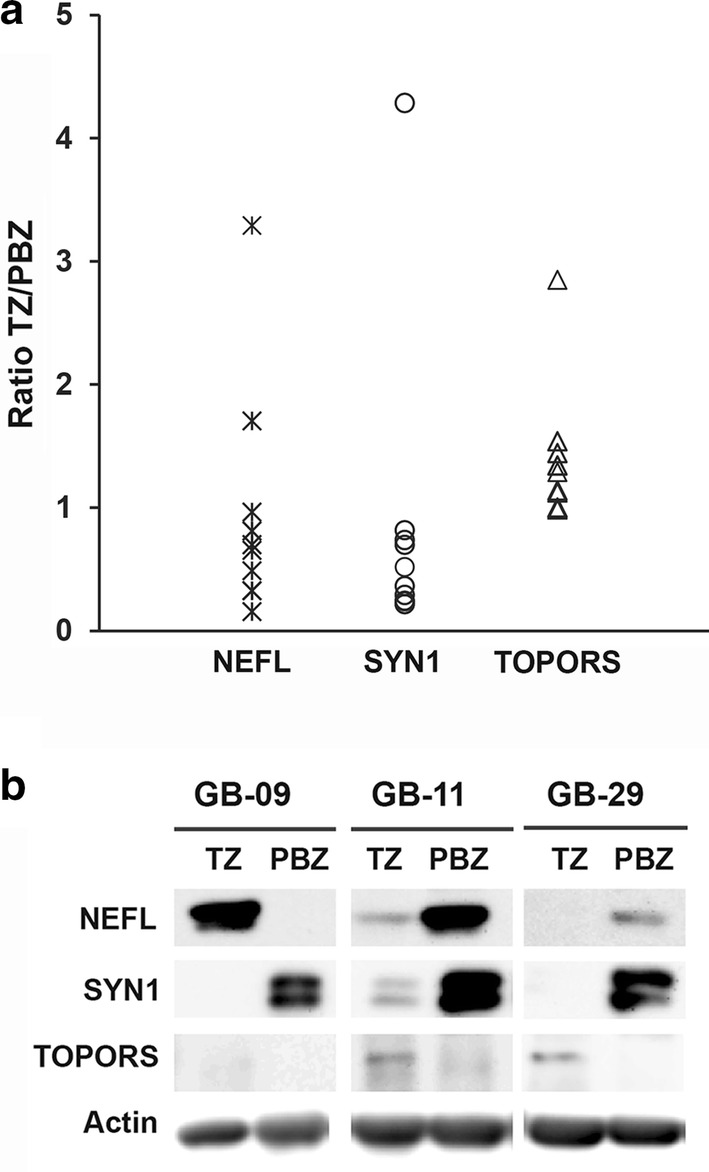
Fig. 1.

Analysis of NEFL, SYN1 and TOPORS expression in TZ biopsies and their corresponding PBZ (n = 11). a Distribution of densitometry data obtained for NEFL, SYN1 and TOPORS in 11 GB patients. Data are presented as TZ/PBZ ratios. b Example of western blot showing the expression of NEFL, SYN1, TOPORS and actin in TZ and PBZ samples
