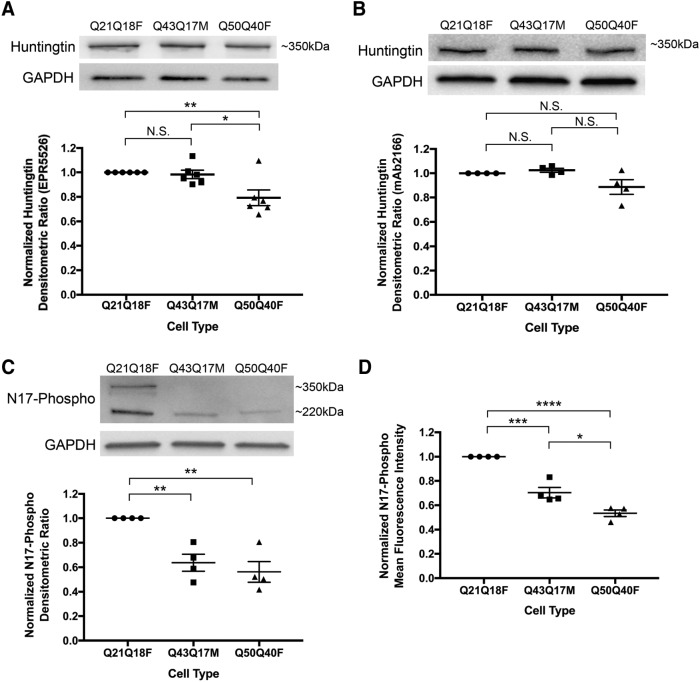
FIGURE 3:
Huntingtin protein levels in TruHD cells. (A) Densitometric analysis of total huntingtin levels using Western blot with EPR5526 antibody. Immunoblots were cut horizontally at the 75-kDa marker so that GAPDH loading control was probed for separately. Normalized to control TruHD-Q21Q18F cells. n = 6. Error bars represent SEM. **p = 0.0087 and *p = 0.0254 by unpaired Student’s t test. (B) Densitometric analysis of total huntingtin levels using Western blot with mAb2166 antibody. Immunoblots were cut horizontally at the 75-kDa marker so that GAPDH loading control was probed for separately. Normalized to control TruHD-Q21Q18F cells. n = 4. Error bars represent SEM. (C) Densitometric analysis of N17-phospho levels using Western blot. Immunoblots were cut horizontally at the 75-kDa marker so that GAPDH loading control was probed for separately. Normalized to control TruHD-Q21Q18F cells. n = 4. Error bars represent SEM. **p = 0.0020 by unpaired t test. (D) Mean fluorescence intensity analysis of N17-phospho using flow cytometry. Normalized to control TruHD-Q21Q18F. n = 4. Error bars represent SEM. ***p = 0.0005, *p = 0.0159 and ****p < 0.0001 by unpaired t test.

